Multimodal Data Visualization Microservice#
Visualize video analytics and time series analytics data using the Grafana* dashboard. Stream multiple videos at once in the same dashboard.
Overview#
The Multimodal Data Visualization Microservice provides functionality to represent the data graphically. Using this service, you can visualize the video streaming and time-series data. The following containers run as part of the Multimodal Data Visualization Microservice:
multimodal-data-visualization
multimodal-data-visualization-streaming
signaling-server
The multimodal-data-visualization-streaming container gets the ingested frames and the inference results from the MsgBus subscriber and it then renders the video to a webpage. This webpage is embedded in Grafana* dashboard to visualize the video stream and the time-series data on the same dashboard.
Programming Languages: Python* and Javascript*
How It Works#
Multimodal Data Visualization Microservice provides the ability to visualize video streaming data and time-series data with application metrics.
The Multimodal Data Visualization Microservice consists of three containers:
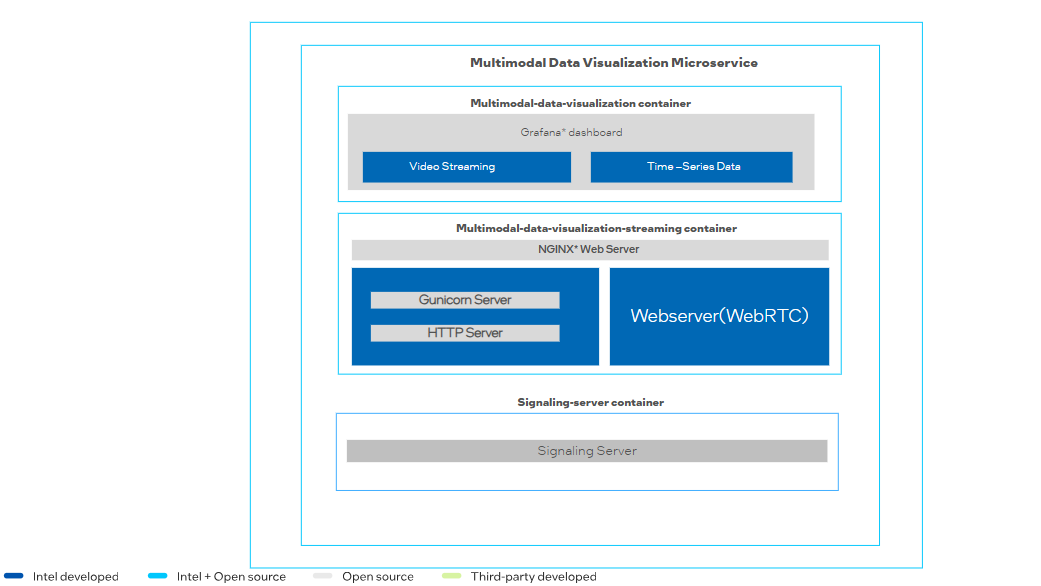
multimodal-data-visualization: This container hosts the Grafana* UI at the front end and includes a sample dashboard that embeds a WebRTC-powered web application served from the multimodal-data-visualization-streaming container alongside the pipeline frame-rate data from the Edge Video Analytics Microservice.
multimodal-data-visualization-streaming: This container hosts a React* web application served through the NGINX* web server that receives a video stream via HTTP, WebRTC or Intel(R) Edge Insights System Message Bus and streams them to the web page in the multimodal-data-visualization container.
signaling-server: This container runs the Session Traversal Utilities for NAT (STUN) signaling server that negotiates the connection between the pipeline server in the Edge Video Analytics Microservice and the React web application in the multimodal-data-visualization-streaming container.
Figure 1: Architecture Diagram#
Learn More#
Follow step-by-step examples to become familiar with the core functionality of the microservice in Tutorials
Get started with the microservice with the Getting Started Guide.