Get Started Guide#
Time to Complete: 30 minutes
Programming Language: Python*, Javascript*
Get Started#
Complete this guide to confirm that your setup is working correctly and try out a basic workflow in the reference implementation.
Prerequisites for Target System#
11th Generation Intel® Core™ processor or above
8 GB of memory minimum
80 GB of storage space minimum
Internet access
Ubuntu* 22.04 LTS Desktop
K8s installation on single or multi node must be done as pre-requisite to continue the following deployment. Note: The kubernetes cluster is set up with
kubeadm,kubectlandkubeletpackages on single and multi nodes withv1.30.2. Refer to tutorials such as https://adamtheautomator.com/installing-kubernetes-on-ubuntu and many other online tutorials to setup kubernetes cluster on the web with host OS as ubuntu 22.04.For helm installation, refer to helm website
Note
If Ubuntu Desktop is not installed on the target system, follow the instructions from Ubuntu to install Ubuntu desktop.
Download the helm chart#
Follow this procedure on the target system to install the package.
Download helm chart with the following command
helm pull oci://registry-1.docker.io/intel/pallet-defect-detection-reference-implementation --version 2.1.0unzip the package using the following command
tar xvf pallet-defect-detection-reference-implementation-2.1.0.tgz
Get into the helm directory
cd pallet-defect-detection-reference-implementation
Configure and update the environment variables#
Update the below fields in
values.yamlfile in the helm chartHOST_IP: # replace localhost with system IP example: HOST_IP: 10.100.100.100 POSTGRES_PASSWORD: # example: POSTGRES_PASSWORD: intel1234 MINIO_ACCESS_KEY: # example: MINIO_ACCESS_KEY: intel1234 MINIO_SECRET_KEY: # example: MINIO_SECRET_KEY: intel1234 http_proxy: # example: http_proxy: http://proxy.example.com:891 https_proxy: # example: http_proxy: http://proxy.example.com:891 VISUALIZER_GRAFANA_USER: # example: VISUALIZER_GRAFANA_USER: admin VISUALIZER_GRAFANA_PASSWORD: # example: VISUALIZER_GRAFANA_PASSWORD: password
Update HOST_IP_where_MRaaS_is_running in
evam_config.jsonfile in the helm chart"model_registry": { "url": "http://<HOST_IP_where_MRaaS_is_running>:32002", "request_timeout": 300, "saved_models_dir": "./mr_models" },
Run multiple AI pipelines#
Follow this procedure to run the reference implementation. In a typical deployment, multiple cameras deliver video streams that are connected to AI pipelines to improve the detection and recognition accuracy. The following demonstrates running two AI pipelines and observing telemetry data from a Grafana* dashboard.
Deploy helm chart
helm install pdd-deploy . -n apps --create-namespace
Verify all the pods and services are running:
kubectl get pods -n apps
kubectl get svc -n apps
Start the pallet defect detection pipeline with the following Client URL (cURL) command. This pipeline is configured to run in a loop forever. This REST/cURL request will return a pipeline instance ID, which can be used as an identifier to query later the pipeline status or stop the pipeline instance. For example, a6d67224eacc11ec9f360242c0a86003.
curl http://<host_system_ip_address>:30107/pipelines/user_defined_pipelines/pallet_defect_detection_mlops -X POST -H 'Content-Type: application/json' -d '{
    "parameters": {
        "detection-properties": {
            "model": "/home/pipeline-server/resources/models/geti/pallet_defect_detection/deployment/Detection/model/model.xml",
            "device": "CPU"
        }
    }
}'
Start another pallet defect detection pipeline with the following Client URL (cURL) command. This pipeline is not configured to run in a loop forever. This REST/cURL request will return a pipeline instance ID, which can be used as an identifier to query later the pipeline status or stop the pipeline instance. For example, a6d67224eacc11ec9f360242c0a86003.
curl http://<host_system_ip_address>:30107/pipelines/user_defined_pipelines/pallet_defect_detection -X POST -H 'Content-Type: application/json' -d '{
    "source": {
        "uri": "file:///home/pipeline-server/resources/videos/warehouse.avi",
        "type": "uri"
    },
    "parameters": {
        "detection-properties": {
            "model": "/home/pipeline-server/resources/models/geti/pallet_defect_detection/deployment/Detection/model/model.xml",
            "device": "CPU"
        }
    }
}'
Note: Note the instance ID of this pipeline
Go to Grafana dashboard on
http://<HOST_IP>:30101/and login with credentials provided invalues.yamlfile. Click onDashboards -> Video Analytics Dashboardon the left to see the telemetry data for both pipelines.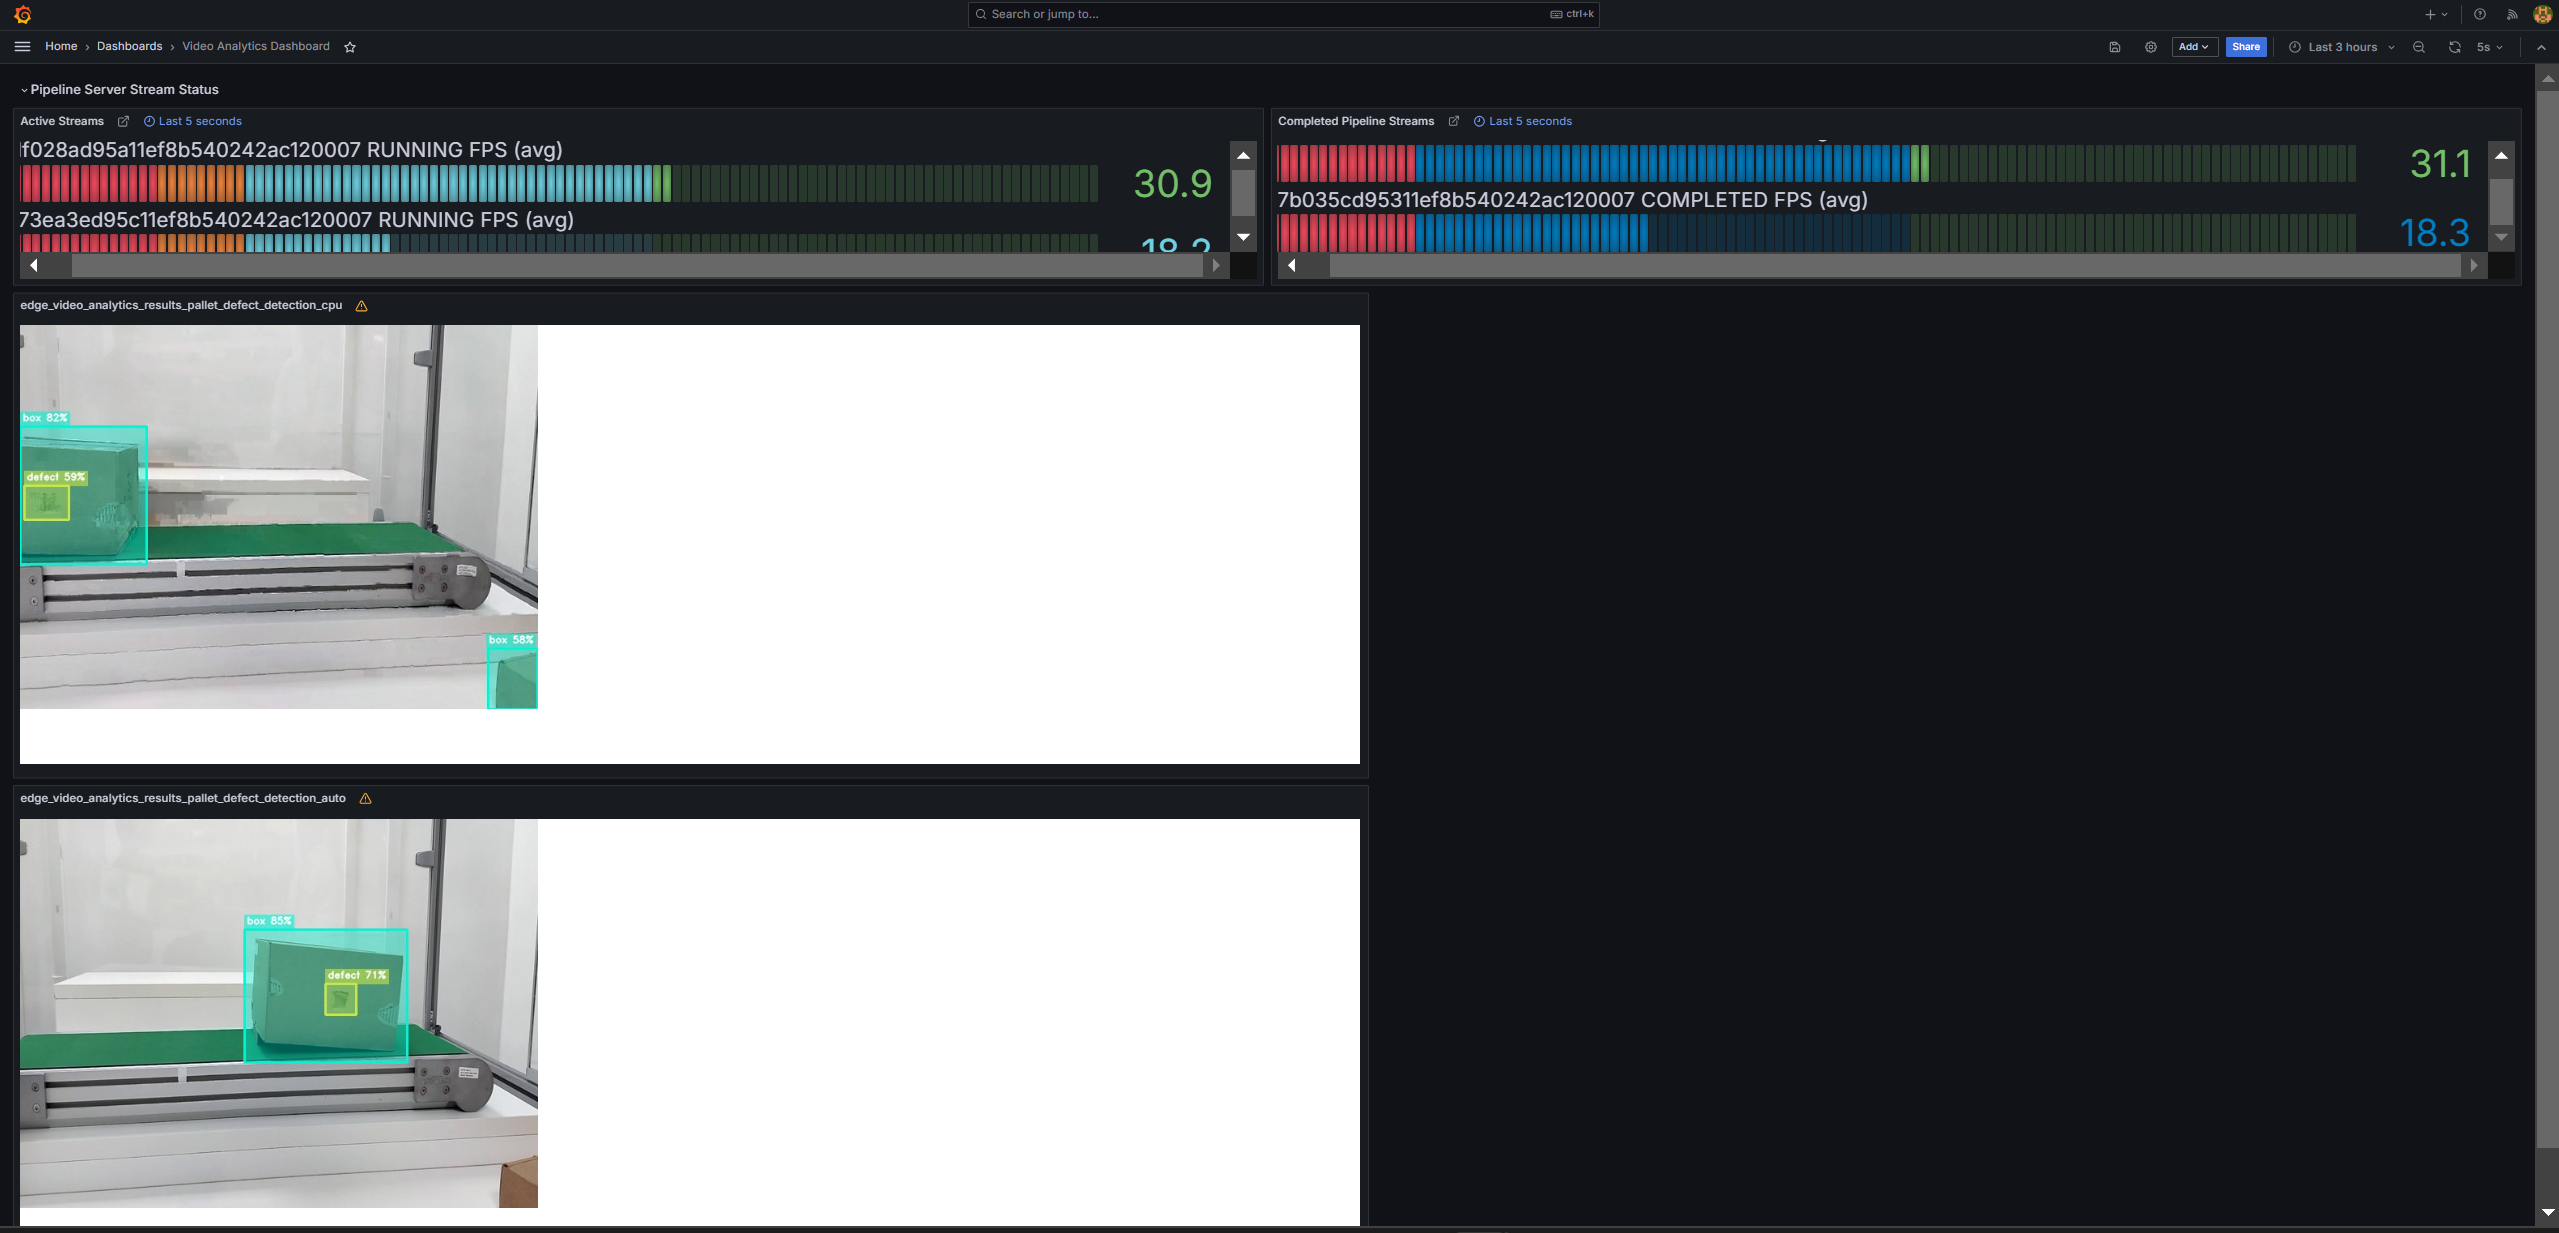
Figure 1: Dashboard with telemetry data of two pipelines
You can see boxes, shipping labels, and defects being detected. You have successfully run the reference implementation.
Advanced details: You can also see the topics on which the results are published by going to
http://<HOST_IP>:30108/topicsand then using those topics to see the streams like so: Stream 1 @http://<HOST_IP>:30108/<topic_1>and Stream 2 @http://<HOST_IP>:30108/<topic_2>Stop the 2nd pipeline using the instance ID noted in point #4 above, before proceeding with this documentation.
curl --location -X DELETE http://<HOST_IP>:30107/pipelines/{instance_id}
MLOps Flow: At runtime, download a new model from model registry and restart the pipeline with the new model.#
Note: We have removed "model-instance-id=inst0" from the pallet_defect_detection_mlops pipeline in evam_config.json to ensure the proper loading of the new AI model in the MLOps flow. However, as a general rule, keeping "model-instance-id=inst0" in a pipeline is recommended for better performance if you are running multiple instances of the same pipeline.
Get all the registered models in the model registry
curl 'http://<host_system_ip_address>:32002/models'
The following step demonstrates how to create a sample model file from an existing model folder for uploading to the Model Registry. If you already have a model zip file, you can skip this step.
 cd <pdd_repo_workdir>/resources/models/geti/pallet_defect_detection
 zip -r ../pallet_defect_detection.zip .
You can utilize the generated
<path>/pallet_defect_detection.zipas<model_file_path.zip>in the next stepUpload a model file to Model Registry
curl -L -X POST "http://<host_system_ip_address>:32002/models" \
-H 'Content-Type: multipart/form-data' \
-F 'name="YOLO_Test_Model"' \
-F 'precision="fp32"' \
-F 'version="v1"' \
-F 'origin="Geti"' \
-F 'file=@<model_file_path.zip>;type=application/zip' \
-F 'project_name="pallet-defect-detection"' \
-F 'architecture="YOLO"' \
-F 'category="Detection"'
Check instance ID of currently running pipeline and use it in the next command
curl --location -X GET http://<HOST_IP>:30107/pipelines/status
Download the files for a specific model from the model registry microservice and restart the running pipeline with the new model. Essentially, the running instance gets aborted and a new instance gets started.
curl 'http://<host_system_ip_address>:30107/pipelines/user_defined_pipelines/pallet_defect_detection_mlops/<instance_id_of_currently_running_pipeline>/models' \
--header 'Content-Type: application/json' \
--data '{
"project_name": "pallet-defect-detection",
"version": "v1",
"category": "Detection",
"architecture": "YOLO",
"precision": "fp32",
"deploy": true,
"pipeline_element_name": "detection"
}'
Note: The data above assumes there is a model in the registry that contains these properties. Note: The pipeline name that follows user_defined_pipelines, will affect the
deploymentfolder name.View the output in Grafana:
http://<HOST_IP>:30101/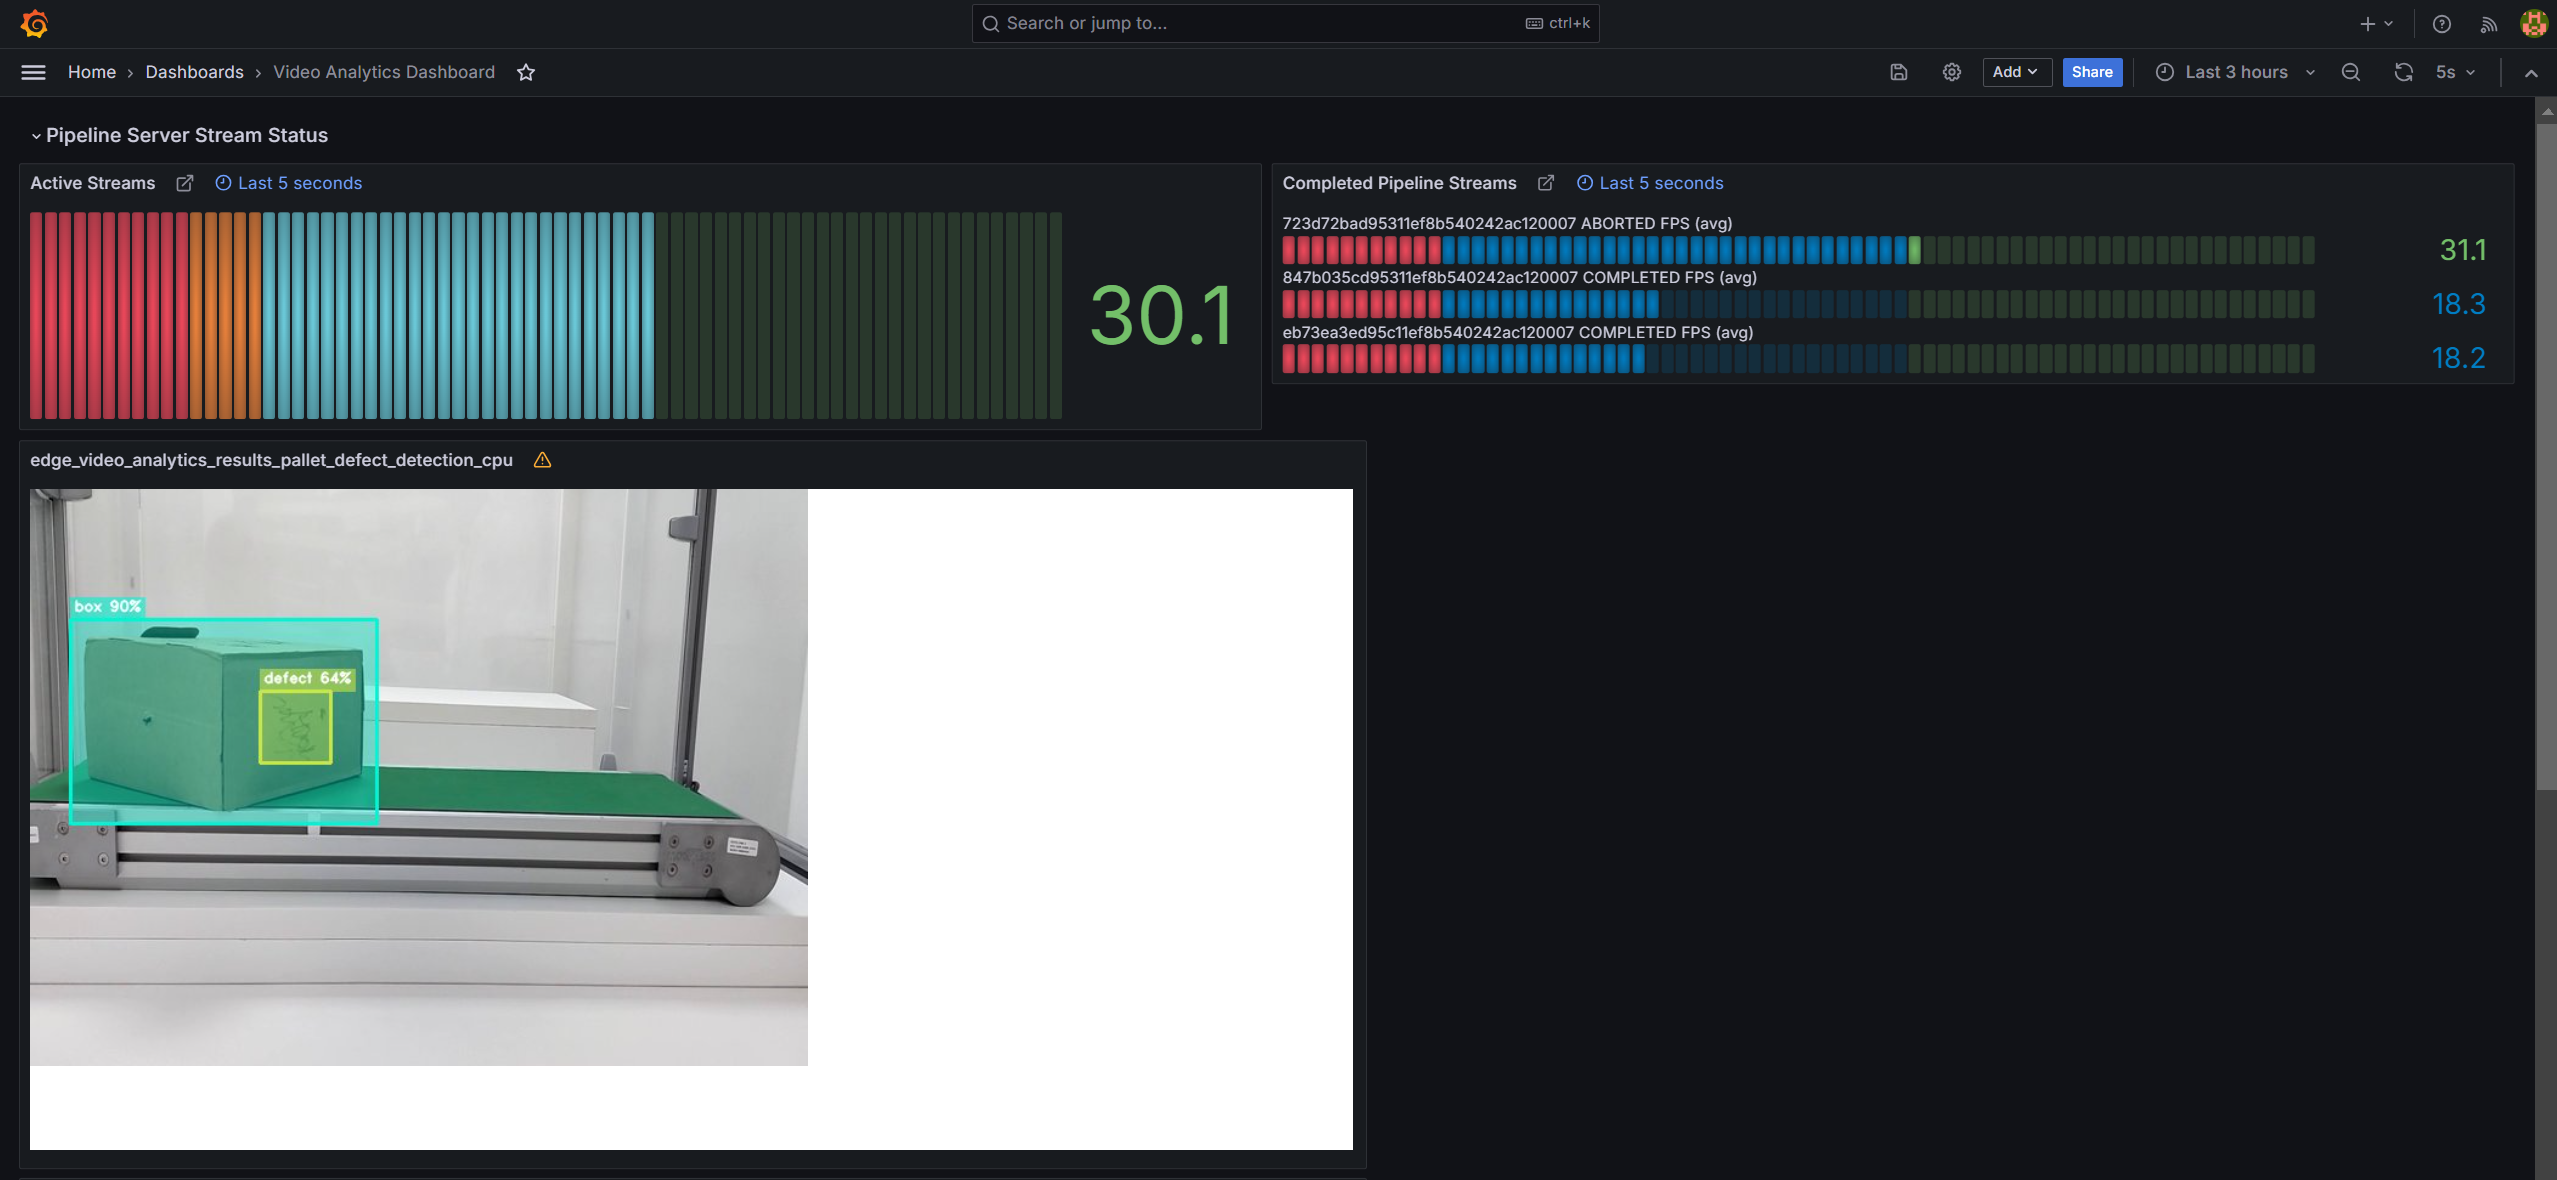
Figure 2: Dashboard with telemetry data of restarted pipeline instance.
You can also stop any running pipeline by using the pipeline instance “id”
curl --location -X DELETE http://<HOST_IP>:30107/pipelines/{instance_id}
EVAM S3 frame storage#
Follow this procedure to test the EVAM S3 storage using the helm.
Install the pip package boto3 once if not installed with the following command
pip3 install boto3==1.36.17
Create a S3 bucket using the following script.
import boto3
url = "http://<HOST-IP>:30800"
user = "<value of MINIO_ACCESS_KEY used in .env>"
password = "<value of MINIO_SECRET_KEY used in .env>"
bucket_name = "ecgdemo"

client= boto3.client(
            "s3",
            endpoint_url=url,
            aws_access_key_id=user,
            aws_secret_access_key=password
)
client.create_bucket(Bucket=bucket_name)
buckets = client.list_buckets()
print("Buckets:", [b["Name"] for b in buckets.get("Buckets", [])])
Start the pipeline with the following cURL command. Ensure to give the correct path to the model as seen below. This example starts an AI pipeline.
curl localhost:30107/pipelines/user_defined_pipelines/pallet_defect_detection_s3write -X POST -H 'Content-Type: application/json' -d '{
   "source": {
         "uri": "file:///home/pipeline-server/resources/videos/warehouse.avi",
         "type": "uri"
   },
   "parameters": {
      "detection-properties": {
            "model": "/home/pipeline-server/resources/models/geti/pallet_defect_detection/deployment/Detection/model/model.xml",
            "device": "CPU"
      }
   }
}'
Go to MinIO console on
http://<HOST_IP>:30800/and login withMINIO_ACCESS_KEYandMINIO_SECRET_KEYprovided invalues.ymlfile. After logging into console, you can go toecgdemobucket and check the frames stored.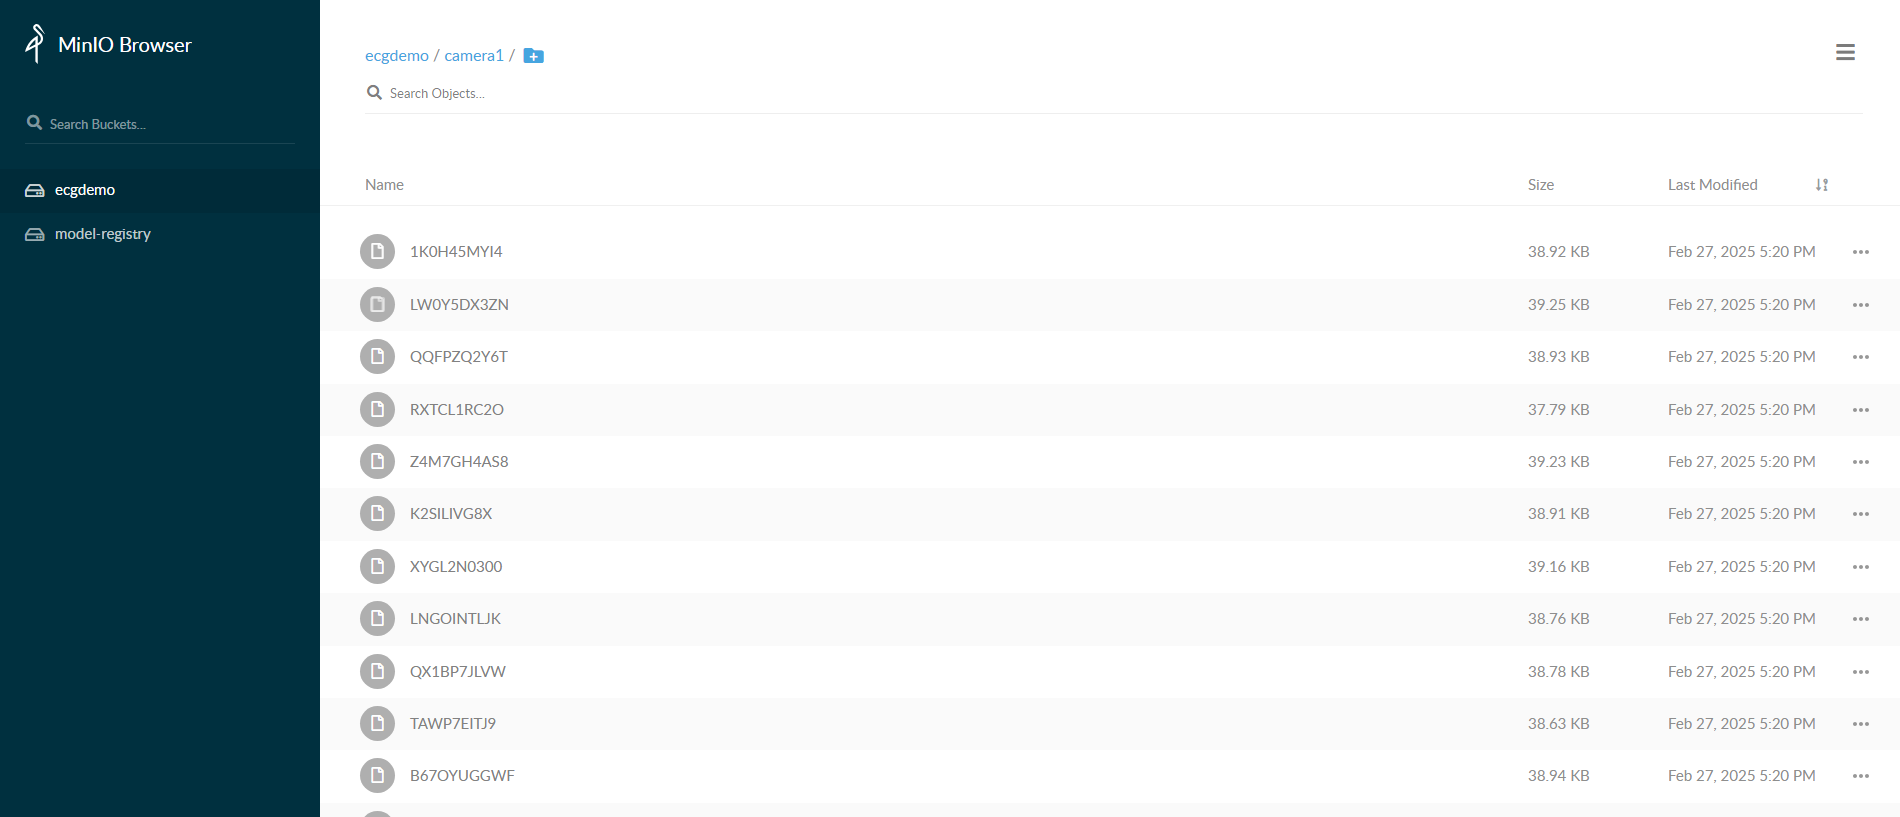
End the demonstration#
Follow this procedure to stop the reference implementation and end this demonstration.
Stop the reference implementation with the following command that uninstalls the release pdd-deploy.
helm uninstall pdd-deploy -n apps
Confirm the pods are no longer running.
kubectl get pods -n apps
Summary#
In this guide, you installed and validated the Pallet Defect Detection Reference Implementation. You also completed a demonstration where multiple pipelines run on a single system with near real-time defect detection.
Learn More#
To create custom pipelines, refer to the Create Pipelines chapter in the User Guide.
Learn more about deploying your own model from Intel® Geti™ platform by using the Deploy Pipeline with Intel® Geti™ Platform Model chapter in the User Guide.
Get to know how to configure the input video source to RTSP, file or web camera input by using the Change Input Video Source chapter in the User Guide.
Details on scaling the video resolution is available here.
Troubleshooting#
The following are options to help you resolve issues with the reference implementation.
Grafana Dashboard#
The firewall may prevent you from viewing the video stream and metrics in the Grafana dashboard. Please disable the firewall using this command.
sudo ufw disable
Error Logs#
View the container logs using this command.
kubectl logs -f <pod_name> -n apps