Enable Open Telemetry#
EVAM supports gathering metrics over Open Telemetry. The supported metrics currently are:
cpu_usage_percentage: Tracks CPU usage percentage of EVAM python processmemory_usage_bytes: Tracks memory usage in bytes of EVAM python processfps_per_pipeline: Tracks FPS for each active pipeline instance in EVAM There is a dedicated docker compose file for demonstrating Open Telemetry for EVAM. It is available in EVAM’s github repository, under the “docker” folder i.e.,[EVAM_WORKDIR]/docker/docker-compose-otel.ymlThe way it works is, EVAM exports the telemetry data to the open telemetry service (otel/opentelemetry-collector-contrib) and then prometheus service scrapes the data which can be visualized. The necessary configuration for open telemetry and prometheus services is located at[EVAM_WORKDIR]/configs/open_telemetry/otel-collector-config.yamland[EVAM_WORKDIR]/configs/open_telemetry/prometheus.ymlrespectively. Below are the necessary configuration to be aware of (or modify accordingly based on your deployment) in[EVAM_WORKDIR]/docker/.env(They will be consumed appropriately in[EVAM_WORKDIR]/docker/docker-compose-otel.yml):
ENABLE_OPEN_TELEMETRY=true # true to enable open telemetry and false otherwise
OTEL_COLLECTOR_HOST=otel-collector # open telemetry container name in `[EVAM_WORKDIR]/docker/docker-compose-otel.yml`. Can also be the IP address of the machine if open telemetry container is running on a different machine. Ex: OTEL_COLLECTOR_HOST=10.10.10.10
OTEL_COLLECTOR_PORT=4318 # Open telemetry container will receive data on this port. If this value is changed, ensure to update `[EVAM_WORKDIR]/configs/open_telemetry/otel-collector-config.yaml` appropriately.
OTEL_EXPORT_INTERVAL_MILLIS=5000 # How often to export metrics to the open telemetry collector in milli seconds.
With this information at hand, let us now see open telemetry in action.
Start the services
docker compose -f docker-compose-otel.yml up
Open another terminal and start a pipeline in EVAM with the below curl command.
    curl http://localhost:8080/pipelines/user_defined_pipelines/pallet_defect_detection -X POST -H 'Content-Type: application/json' -d '{
    "source": {
        "uri": "file:///home/pipeline-server/resources/videos/warehouse.avi",
        "type": "uri"
    },
    "destination": {
        "metadata": {
            "type": "file",
            "path": "/tmp/results.jsonl",
            "format": "json-lines"
        },
        "frame": {
            "type": "rtsp",
            "path": "pallet-defect-detection"
        }
    },
    "parameters": {
        "detection-properties": {
            "model": "/home/pipeline-server/resources/models/geti/pallet_defect_detection/deployment/Detection/model/model.xml",
            "device": "CPU"
        }
    }
}'
Note down the
pipeline_idreturned by this command. Ex: “658a5260f37d11ef94fc0242ac160005”Open
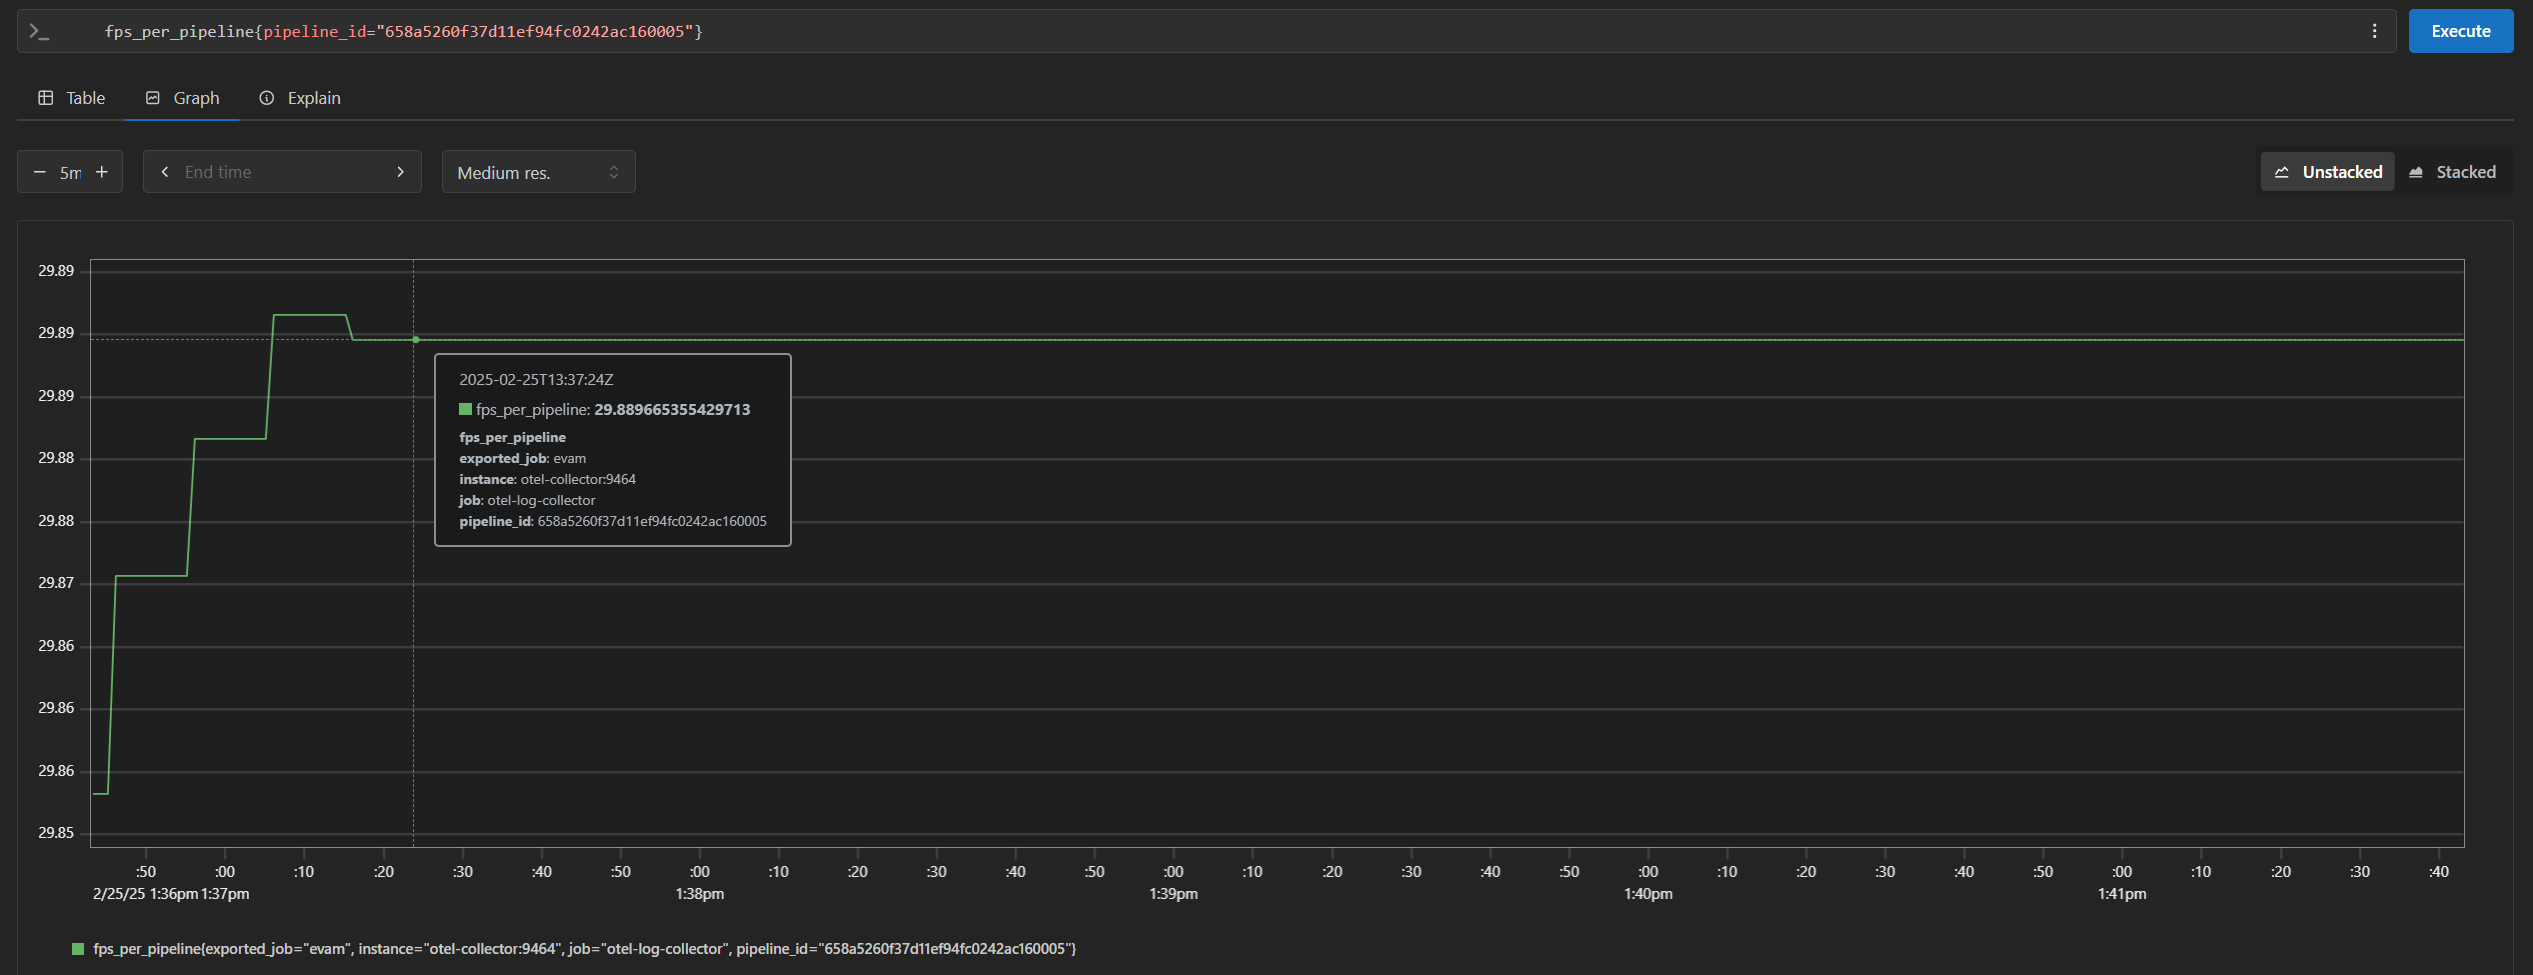
http://<HOST_IP>:<PROMETHEUS_PORT>in your browser to view the prometheus console and try out the below queries (PROMETHEUS_PORTis by default configured as 9999 in[EVAM_WORKDIR]/docker/.envfile):cpu_usage_percentagememory_usage_bytesfps_per_pipeline{}If you are starting multiple pipelines, then it can also be queried per pipeline ID. Example:
fps_per_pipeline{pipeline_id="658a5260f37d11ef94fc0242ac160005"}