Native Linux RT Development Tutorial#
Overview#
Developing native real-time (RT) applications on Linux optimized for important metrics, such as jitter and execution time may not always be trivial.
In this tutorial, we talk about system configuration prerequisites, best practices and experiments so that you can achieve the best results in your native Linux RT development.
How It Works#
This tutorial provides a sample application that demonstrates best known practices in writing RT applications natively on Linux. The reference source code lets you experiment with various parameters that affect real-time operation to help inform you on how to best develop and optimize your own Linux RT application.
Real-Time Development & Debugging References#
The Linux Foundation – HOWTO build a simple RT application
https://wiki.linuxfoundation.org/realtime/documentation/howto/applications/application_base
The Linux Foundation – RT latency debugging
https://wiki.linuxfoundation.org/realtime/documentation/howto/debugging/start
Using Linux
perfhttps://perf.wiki.kernel.org/index.php/Tutorial https://www.brendangregg.com/perf.html#SchedulerAnalysis
Linux RT Application Development Prerequisites#
Linux real-time application development requires a PREEMPT_RT kernel, BIOS optimizations and kernel boot optimizations.
Use the recommended BIOS optimizations for real-time Linux.
Use a real-time Linux kernel.
See also
See Setting Up An Optimized Intel-Based Linux Real-Time Capable Edge System for a Reference Implementation to achieving a real-time capable system
Setup Package Repository#
![]()
![]()
Setup the ECI APT repository:
Download the ECI APT key to the system keyring:
$ sudo -E wget -O- https://eci.intel.com/repos/gpg-keys/GPG-PUB-KEY-INTEL-ECI.gpg | sudo tee /usr/share/keyrings/eci-archive-keyring.gpg > /dev/null
Add the signed entry to APT sources and configure the APT client to use the ECI APT repository:
$ echo "deb [signed-by=/usr/share/keyrings/eci-archive-keyring.gpg] https://eci.intel.com/repos/$(source /etc/os-release && echo $VERSION_CODENAME) isar main" | sudo tee /etc/apt/sources.list.d/eci.list
$ echo "deb-src [signed-by=/usr/share/keyrings/eci-archive-keyring.gpg] https://eci.intel.com/repos/$(source /etc/os-release && echo $VERSION_CODENAME) isar main" | sudo tee -a /etc/apt/sources.list.d/eci.list
Configure the ECI APT repository to have higher priority over other repositories:
$ sudo bash -c 'echo -e "Package: *\nPin: origin eci.intel.com\nPin-Priority: 1000" > /etc/apt/preferences.d/isar'
Update the APT sources lists:
$ sudo apt update
Tip
If the APT package manager is unable to connect to the repositories, follow these APT troubleshooting tips:
Make sure that the system has network connectivity.
Make sure that the ports
80and8080are not blocked by a firewall.Configure an APT proxy (if network traffic routes through a proxy server). To configure an APT proxy, add the following lines to a file at
/etc/apt/apt.conf.d/proxy.conf(replace the placeholders as per your specific user and proxy server):Acquire::http::Proxy "http://user:password@proxy.server:port/"; Acquire::https::Proxy "http://user:password@proxy.server:port/";
![]()
Setup the ECI DNF repository:
Use the
config-managertool to add the ECI DNF repository to the system:$ sudo dnf config-manager --add-repo https://eci.intel.com/repos/rhel/eci-el9.repo
Verify the ECI DNF repository was correctly added. Run the following command and verify that the ECI DNF repository
eci-el#-rpm-*are present:$ dnf repolist
repo id                          repo name
eci-el9-rpm-x86_64               Intel Edge Controls for Industrial - EL9 (x86_64)
eci-el9-rpm-noarch               Intel Edge Controls for Industrial - EL9 (noarch)
Some of the ECI packages depend on additional DNF repositories, specifically Extra Packages for Enterprise Linux (EPEL). Configure the DNF package manager with these additional DNF repositories:
$ sudo dnf install -y https://dl.fedoraproject.org/pub/epel/epel-release-latest-9.noarch.rpm
Install Real-time Development Tutorial#
Perform either of the following commands to install this component:
![]()
![]()
- Install from meta-package
$ sudo apt install eci-realtime-benchmarking
- Install from individual Deb package
$ sudo apt install eci-rt-dev-tutorial
![]()
- Install from meta-package
$ sudo dnf install eci-realtime-benchmarking
- Install from individual RPM package
$ sudo dnf install eci-rt-dev-tutorial
Application Overview#
The tutorial and source reference application defines several command-line parameters that controls execution flow. This permits experimenting with various options that affects real-time operation. These options include: the number of sample and workload iterations, size of the memory block to allocate, whether to run as a real-time priority thread, whether to lock memory, the time interval for yielding to system events, and whether to vary the interval to establish a fixed cycle time cadence.
The application output includes: the minimum and maximum workload execution times in both μs and clock cycles, the jitter, and the count of missed cycle times when enabled. The output may be formatted as human-readable or comma separated (CSV) for easy import to another application.
If real-time scheduling latency is of interest, consider running cyclictest.
Parameter Summary and Sample Output#
After installing the real-time development tutorial, execute the tutorial application with the -h flag:
$ /opt/eci-rt-dev-tutorial/rtdevtut -h
Usage: rtdevtut [OPTION]...
    -c : Core affinity, default: 1
    -f : stream output to the specified CSV File, default: no file output
    -h : display this Help and exit
    -i : Iterations of workload to process per sample, default: 500
    -l : Lock memory to prevent page faults, default: disabled
    -m : Memory block allocated by workload, default: 10,000
    -p : Priority of workload thread run as real-time, default: non-RT
    -s : Samples to process and display, default: 40
    -t : Time to yield control to system each interval (in μs), default: 100
    -y : enable cYcle time -t and trigger trace when exceeded, default: disabled

Output displayed for each sample:
Sample:       Sample number
Timestamp:    Timestamp at the beginning of the sample
Jitter μs:    Jitter between min and max workload execution time (in μs)
Min μs:       Minimum workload execution time (in μs)
Max μs:       Maximum workload execution time (in μs)
Elapsed μs:   Elapsed sample execution time (in μs)
Clk Cycles:   Jitter between min and max workload execution time (in clock cycles)
Min Clk:      Minimum workload execution time (in clock cycles)
Max Clk:      Maximum workload execution time (in clock cycles)
Missed CT:    Count of workload executions that exceeded cycle time
Sample output:
Sample  Timestamp           Jitter μs     Min μs     Max μs    Elapsed μs    Clk Cycles       Min Clk       Max Clk
     1  23:51:33.551293075          1        287        288       197,461         2,402       746,112       748,514
     2  23:51:33.748754902          2        287        289       197,441         4,060       746,138       750,198
     3  23:51:33.946196694          1        287        288       197,456         2,150       746,140       748,290
     4  23:51:34.143653744          1        287        288       197,451         1,904       746,130       748,034
     5  23:51:34.341105005          1        287        288       197,452         3,054       746,116       749,170
                           ---------- ---------- ---------- ------------- ------------- ------------- -------------
Avg:                                1        287        288       197,452         2,714       746,127       748,841
Abs:                                         287        289                                   746,112       750,198
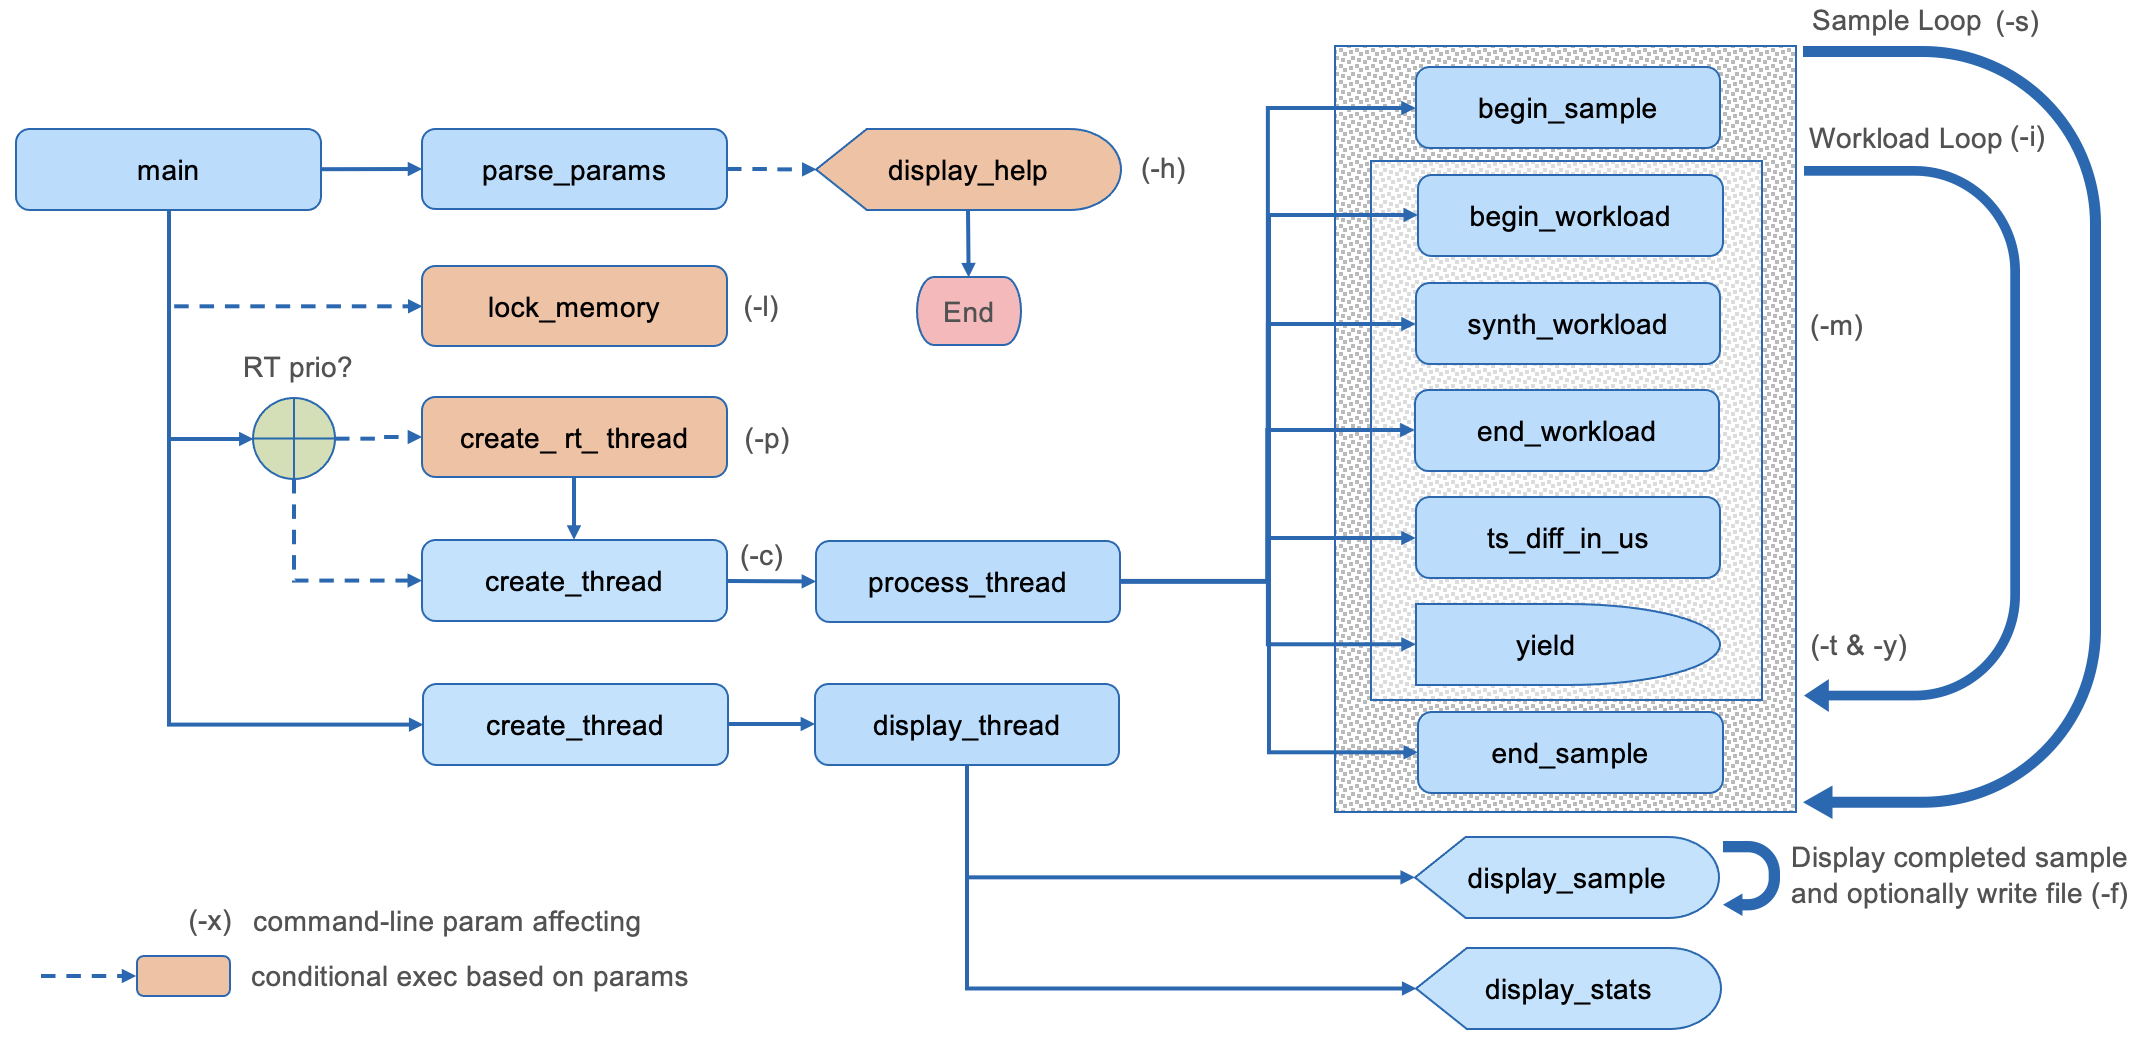
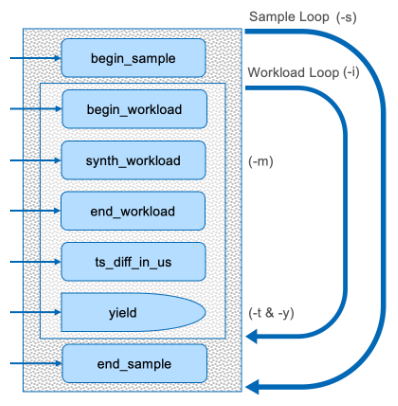
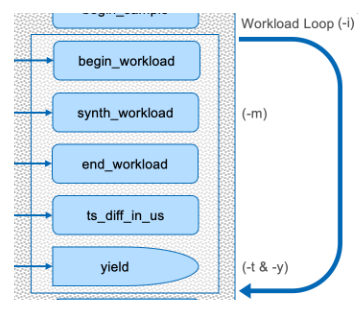
Function Flow#
Parameter Details#
Samples (-s)#
The samples parameter (-s) controls the number of workload samples that are output. The output displays the jitter and executions times as explained on an earlier slide. The default is 25 with valid values in the range of 1 to 10,000. Specifying a value outside of that range will automatically be converted to a valid minimum/maximum value. Increase this value for long running experiments.
// Process the number of samples specified
for (int nbr = 0; nbr < params->samples; nbr++) {
   begin_sample(nbr + 1, &sample);
   // Call the workload for the specified iterations each sample
   for (int i = 0; i < params->iterations; i++) {
    ...
   }
 ...
}
Iterations (-i)#
The iterations parameter (-i) controls the number of times the workload is called for each sample. The synthetic workload performs various computations and memory operations. The default is 100 with valid values in the range of 1 to 10,000. Specifying a value outside of that range will automatically be converted to a valid minimum/maximum value. Experiment with increasing and decreasing this value and note the effect.
// Call the workload for the specified iterations each sample
for (int i = 0; i < params->iterations; i++) {
   // Execute workload and capture time metrics
   workload.begin_cyc = workload_start(&workload.begin_us);
   synth = synth_workload(synth % 255, params->mem_size);
   workload.end_cyc = workload_end(&workload.end_us);
 ...
}
uint64_t __attribute__((optimize("O0"))) synth_workload(int val, size_t mem_size) {
 ...
}
Memory Allocation (-m)#
The memory parameter (-m) controls the size of the memory block malloc’ed by the workload. The default is 102,400 bytes with valid values in the range of 1 to 10,000,000. Specifying a value outside of that range will automatically be converted to a valid minimum/maximum value. Experiment with increasing and decreasing this value and note the effect.
uint64_t __attribute__((optimize("O0"))) synth_workload(int val, size_t mem_size) {
 ...
   // Allocate a buffer and fill with specified value
   char *buf1 = (char*)malloc(mem_size);
   memset(buf1, val, mem_size);
   // Allocate another buffer and copy from first
   char *buf2 = (char*)malloc(mem_size);
   memcpy(buf2, buf1, mem_size);
   free(buf1);
   // Modify each byte of the 2nd buffer with a random value and add to return val
   for (int i = 0; i < mem_size; i++) {
       buf2[i] &= rand() % 0xFF;
       ret += buf2[i];
   }
   free(buf2);
 ...
}
Time Interval (-t)#
The time interval parameter (-t) controls the time (in μs) that the workload loop sleeps each iteration. The default is 1,000 (1ms) with valid values in the range of 0 to 10,000. Specifying a value outside of that range will automatically be converted to a valid minimum/maximum value. Experiment with increasing and decreasing this value and note the effect.
for (int i = 0; i < params->iterations; i++) {
   // Execute workload and capture time metrics
    ...
   // Collect min and max μs
   workload.exec_us = ts_diff_in_us(workload.begin_us, workload.end_us);
    ...
   // Collect min and max clock cycles
   workload.exec_cyc = workload.begin_cyc < workload.end_cyc
           ? workload.end_cyc - workload.begin_cyc : workload.begin_cyc - workload.end_cyc;
    ...
   // Yield to kernel
   yield(params, &workload, sample);
}

inline void yield(const Params *params, const Workload *workload, Sample *sample) {
   // Give the kernel a chance to process requests so that it doesn't starve.
   struct timespec sleep_ns = {0, params->sleep_us * 1000};
   ...
   // Yield to system
   if (sleep_ns.tv_nsec) clock_nanosleep(CLOCK_REALTIME, 0, &sleep_ns, NULL);
}
Cycle Time (-y)#
The cycle time parameter (-y) changes the effect of yield time from a fixed value to one the varies based on workload execution time to maintain a consistent cadence. Specifying this parameter enables cycle time, which is normally disabled. First determine the typical max μs and increase that slightly for the specified yield time (-t) and then enable cycle time (-y). Experiment with increasing and decreasing the timing and note the effect.
for (int i = 0; i < params->iterations; i++) {
   // Execute workload and capture time metrics
    ...
   // Collect min and max μs
   workload.exec_us = ts_diff_in_us(workload.begin_us, workload.end_us);
    ...
   // Collect min and max clock cycles
   workload.exec_cyc = workload.begin_cyc < workload.end_cyc
           ? workload.end_cyc - workload.begin_cyc : workload.begin_cyc - workload.end_cyc;
    ...
   // Yield to kernel
   yield(params, &workload, sample);
}

inline void yield(const Params *params, const Workload *workload, Sample *sample) {
   // Give the kernel a chance to process requests so that it doesn't starve.
   struct timespec sleep_ns = {0, params->sleep_us * 1000};

   // When cycle time is enabled, calculate variable sleep period to maintain cadence
   if (params->cycle_time) {
       if (params->sleep_us > workload.exec_us) {
           sleep_ns.tv_nsec = (params->sleep_us - workload.exec_us) * 1000;
       } else {
           sleep_ns.tv_nsec = 1000;
           sample.cyc_tm_miss++;
       }
   }

   // Yield to system
   if (sleep_ns.tv_nsec) clock_nanosleep(CLOCK_REALTIME, 0, &sleep_ns, NULL);
}
Note that enabling cycle time also enables tracing and writes a trace marker whenever cycle time is exceeded.
CPU Core Affinity (-c)#
The CPU core affinity parameter (-c) changes the core on which the application’s process thread is executed. The default is 1 with valid values in the range of 0 to core count - 1. Specifying a value outside of that range will automatically be converted to 0. Experiment with changing this value and note the effect, especially when switching from a between an isolated and non-isolated core.
A tutorial is provided that exercises this parameter: CPU Core Affinity
pthread_t create_thread(size_t core_affinity, void* (*thread_fnc)(void*),
       char *thread_name, void *thread_arg) {

   int rc;
   pthread_t thread_id = 0;

   do {
       if (pthread_create(&thread_id, NULL, thread_fnc, thread_arg) != 0) {
           printf("Error: cannot create thread for %s", thread_name);
           break;
       }

       pthread_setname_np(thread_id, thread_name);

       cpu_set_t cpuset;
       CPU_ZERO(&cpuset);
       CPU_SET(core_affinity, &cpuset);
       if ((rc = pthread_setaffinity_np(thread_id, sizeof(cpu_set_t), &cpuset))) {
           printf("Warning: unable to set CPU affinity for %s (err: %s)\n", thread_name, strerror(rc));
           break;
       }

       if (CPU_ISSET(core_affinity, &cpuset)) {
           printf("CPU core affinity: %ld\n", core_affinity);
       }
   } while (false);

   return thread_id;
}
Memory Locking (-l)#
The memory locking parameter (-l) controls whether memory allocated by the application is locked or not. The default when the parameter is not specified is to not lock memory. Experiment with switching between locked and non-locked memory.
A tutorial is provided that exercises this parameter: Memory Locking
int lock_memory() {
   // Lock all virtual address space into RAM, preventing memory from being paged to the swap area
   #define PRE_ALLOCATION_SIZE (50 * 1000 * 1024) // 50 MB pagefault free buffer

   // Lock all current and future pages from preventing of being paged
   if (mlockall(MCL_CURRENT | MCL_FUTURE)) {
       perror("Error: mlockall() failed");
       return 1;
   }

   // Turn off malloc trimming
   mallopt(M_TRIM_THRESHOLD, -1);

   // Turn off mmap usage
   mallopt(M_MMAP_MAX, 0);

   // Reserve process memory
   char *buffer = calloc(1, PRE_ALLOCATION_SIZE);
   if (!buffer) {
       printf("Error pre-allocating memory block\n");
       return 1;
   }

   // Touch each page in this piece of memory to permanently mapped it into RAM by pagefaults
   for (int i = 0; i < PRE_ALLOCATION_SIZE; i += sysconf(_SC_PAGESIZE)) {
       buffer[i] = 0;
   }
   free(buffer);
   return 0;
}
Priority (-p)#
The priority parameter (-p) sets the thread priority of executing the workload. When this parameter is omitted or set to zero, which is the default, the thread is not real-time. Setting it to 99 (-p 99) ensures RT execution. Experiment with changing this value and note the effect.
A tutorial is provided that exercises this parameter: Real-Time Priority
pthread_t create_rt_thread(int16_t thread_priority, size_t core_affinity, void* (*thread_fnc)(void*),
       char *thread_name, void *thread_arg) {

   int rc;
   pthread_t thread_id = 0;

   do {
       thread_id = create_thread(core_affinity, thread_fnc, thread_name, thread_arg);

       // Set thread priority
       struct sched_param sched_parm;
       sched_parm.sched_priority = thread_priority;
       if (pthread_setschedparam(thread_id, SCHED_FIFO, &sched_parm) != 0) {
           printf("Warning: Failed setting thread real-time priority for %s. Are you running as sudo?\n", thread_name);
           break;
       }
       printf("RT thread priority: %d\n", sched_parm.sched_priority);

       // Verify the change in thread priority
       int policy = SCHED_FIFO;
       if ((rc = pthread_getschedparam(thread_id, &policy, &sched_parm))) {
           printf("Warning: unable to verify thread priority for %s (err: %s)\n", thread_name, strerror(rc));
       }

       // Check the correct policy was applied
       if (policy != SCHED_FIFO) {
           printf("Warning: thread scheduling is NOT SCHED_FIFO for %s\n", thread_name);
       }
   } while (false);

   return thread_id;
}
RT Application Tutorials#
These tutorials will generally all require one terminal for executing the tutorial application and at least one additional terminal for executing various stressors that affect the behavior of the application, and/or monitors to capture statistics about its operation. It is preferable to remotely access the system executing the tutorials via SSH to avoid desktop GUI interrupts impacting the measurements.
- These tutorials include:
CPU Core Affinity – executing on an isolated core to minimize the affect from the system and other applications
Memory Locking – locking memory to avoid page faults which cause interrupts and affected determinism
Real-Time Priority – executing the application with a RT priority thread to avoid preemption
RT Application Tutorials Prerequisites#
Configure your development system to match the setting specified in Linux RT Application Development Prerequisites. This includes, using a real-time Linux kernel, proper BIOS RT settings, and kernel boot parameters which isolates cores 1 & 3, and disable c-states, various interrupts, power optimizations, etc.
CPU Core Affinity Tutorial#
Running the tutorial application on CPU Core that has been isolated improves determinism. The CPU Core parameter (-c) allows selection of a core which is isolated or not. Assuming the recommended kernel boot parameters have been used, cores 1 and 3 are isolated while the remaining are not.
Test on a non-isolated core#
Terminal – start executing the tutorial application on core 2 (non-isolated)
$ sudo /opt/eci-rt-dev-tutorial/rtdevtut –p 99 -l –c 2
After the tutorial application has completed, note that the average jitter will be a little higher than the average when running isolated.
Avg: 14
Test on an isolated core#
Terminal – start executing the tutorial application on core 1 (isolated)
$ sudo /opt/eci-rt-dev-tutorial/rtdevtut –p 99 -l –c 1
After the tutorial application has completed, make note of the average jitter (second column in the final stats).
Avg: 6
Memory Locking Tutorial#
Page faults negatively affect determinism. The memory locking parameter (-l) prevents most, if not all, page faults from occurring in the application. This experiment requires two terminals, one for executing the tutorial and one for collecting the performance statistics.
Test w/o memory page locking#
Terminal #1 – start executing the tutorial application first
$ sudo /opt/eci-rt-dev-tutorial/rtdevtut
Terminal #2 – while the app is running start collecting the performance stats
$ sudo perf stat -t $(ps -T -C rtdevtut | tail -1 | awk '{ print $2 }')
After the tutorial application has completed, the performance stats will be display in terminal #2. Find the “page-faults” value which will likely be a large number
37,410 page-faults
Test with memory page locking#
Terminal #1 – Relaunch the tutorial application specifying the memory locking parameter (-l)
$ sudo /opt/eci-rt-dev-tutorial/rtdevtut -l
Terminal #2 – Relaunch the performance stats
$ sudo perf stat -t $(ps -T -C rtdevtut | tail -1 | awk '{ print $2 }')
Note that page faults have now been eliminated (or nearly so)
0 page-faults
Real-Time Priority Tutorial#
A real-time application preempts others that are not. The priority parameter (-p) sets the thread priority executing the workload. When this parameter is omitted or set to zero the thread is not real-time. Setting it to 99 (-p 99) ensures RT execution. This experiment requires two terminals, one for executing the tutorial and one for stressing the system.
Test with real-time priority#
Terminal #1 – launch the tutorial application and make a note of the Elapsed μs
$ sudo /opt/eci-rt-dev-tutorial/rtdevtut –c 1 -s 100 -i 500 -m 10000 -t 100 -p 99
Terminal #2 – while the app is running launch stress-ng
$ stress-ng –-taskset 1 --matrix 0
Note, that starting the stressor application has little affect on the Elapsed μs. Complete this experiment by pressing CTRL-C to stop stress-ng in terminal #2.
Test with non-RT priority#
Terminal #1 – launch the tutorial application but switch to executing non-RT, and again make a note of the Elapsed μs
$ sudo /opt/eci-rt-dev-tutorial/rtdevtut –c 1 -s 100 -i 500 -m 10000 -t 100 -p 0
Terminal #2 – while the app is running start stress-ng
$ stress-ng –-taskset 1 --matrix 0
Note, that starting the stressor application has significantly affected the Elapsed μs. Complete this experiment by pressing CTRL-C to stop stress-ng in terminal #2.
Application Tracing#
The first step is to install a tracing visualization tool called catapult. Visit this webpage for an overview of how to install and use the catapult tool. Note that this webpage describes using it for TSN diagnostics, but the basic concepts are the same for what we will use the catapult tool for. Once the tool has been installed, configured and you have gained a basic understand of how to use this tool you may continue with this section.
Recording a trace produces a great deal of data so we try to minimize the amount of data collected by running the catapult tool for a very short amount of time, just a few seconds. Within the time window that the trace is being recorded we will run the tutorial application in parallel with either another instance of the application or a tool that stresses the system. The goal is to capture the impact of the system and other applications upon the regular workflow execution cadence of the tutorial application. It may take multiple attempt to capture a good trace for analysis.
Note, the steps to capture and analyze a trace will be listed for each example below, but a explanation of how to fully utilize the catapult application is out of scope in this tutorial.
Preemption by a Higher Priority Application#
Capturing the trace#
These are the steps that should produce a trace that can be used to visualize preemption to an application on a RT application.
Prepare terminal #1 to launch the tutorial application with an RT priority of 98 by typing in the following command, but don’t run it yet:
$ sudo /opt/eci-rt-dev-tutorial/rtdevtut –c 1 -s 100 -p 98 -l
Prepare terminal #2 to launch the tutorial application with an RT priority of 99 by typing in the following command, but don’t run it yet:
$ sudo /opt/eci-rt-dev-tutorial/rtdevtut –c 1 -s 15 -p 99 -l
Prepare catapult to record a trace by opening the catapult webpage in a browser, but don’t start recording yet:
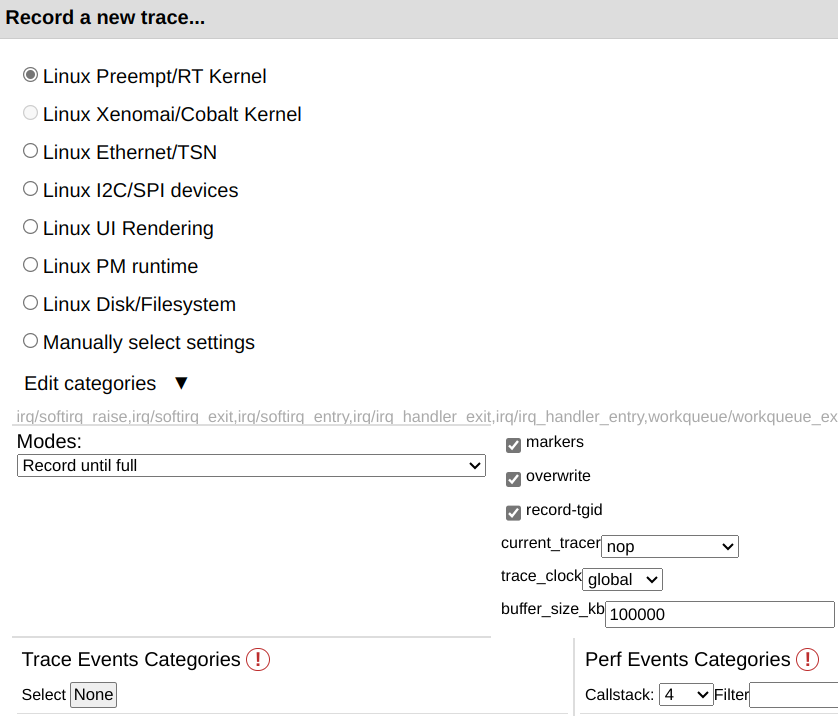
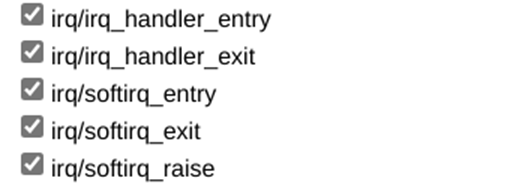
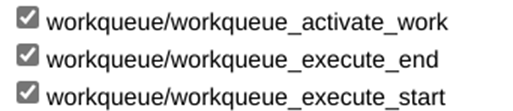
These trace event categories determine what data is captured and should be selected:


Record the trace by performing each of the follow steps in quick succession:
Press ‘Enter’ in terminal #1 to start the first instance of the tutorial application running at a lower priority
Press ‘Record’ button in catapult application to start the trace recording

Press ‘Enter’ in terminal #2 to start the second instance of the tutorial application running at a higher priority
Press ‘Stop’ button in catapult application to stop the trace recording immediately after the tutorial application in terminal #2 completes executing

Analyzing the trace#
Once catpult has been given time to process the trace log it will display the captured events on a visual timeline chart. Scroll down to find the two rtdevtut tasks and click the arrow to expand and view the threads for each.
Choose the selection option from the floating icon menu.

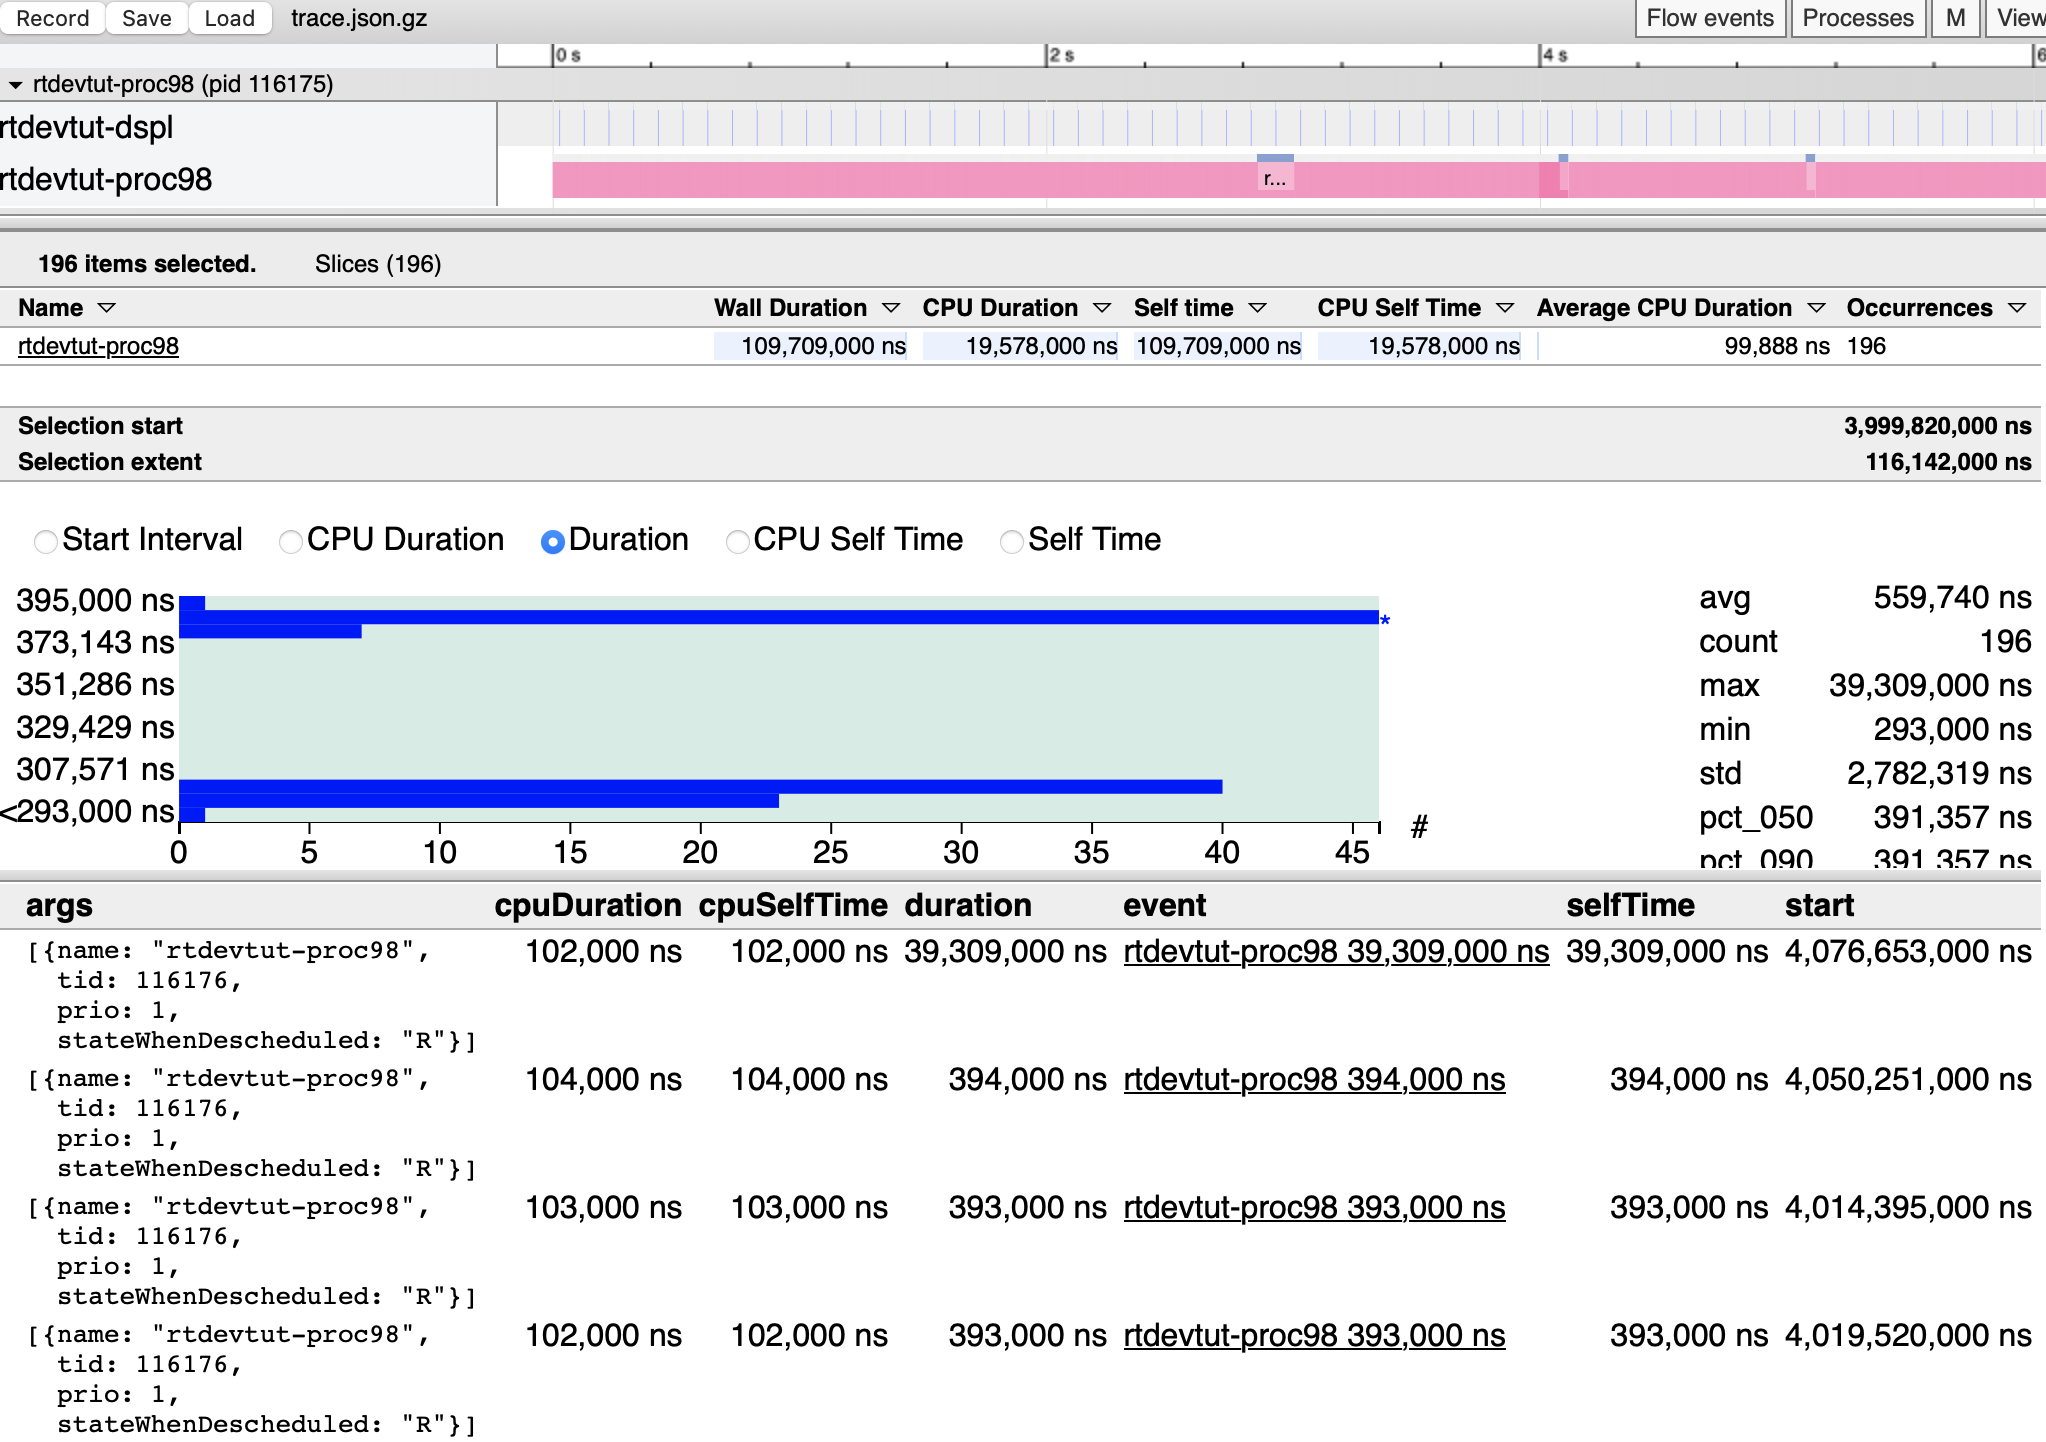
Using the mouse, click and drag to select a portion of the rtdevtut-proc98 task. When the mouse button is released, it will process the selection (which may take a moment) and display a Duration chart along with a list of each individual event at the bottom of the catapult window. The goal here is to try and select a portion of the chart which contains an outlier that can be further analyzed.
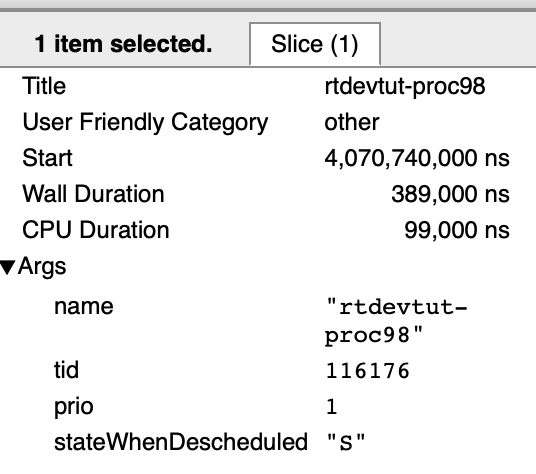
Clicking the hyperlink for one of the events will display that slice. Choose and event that has an execution time outside the regular cadence for analysis.
Press the m key to mark that event/slice in the timeline chart.
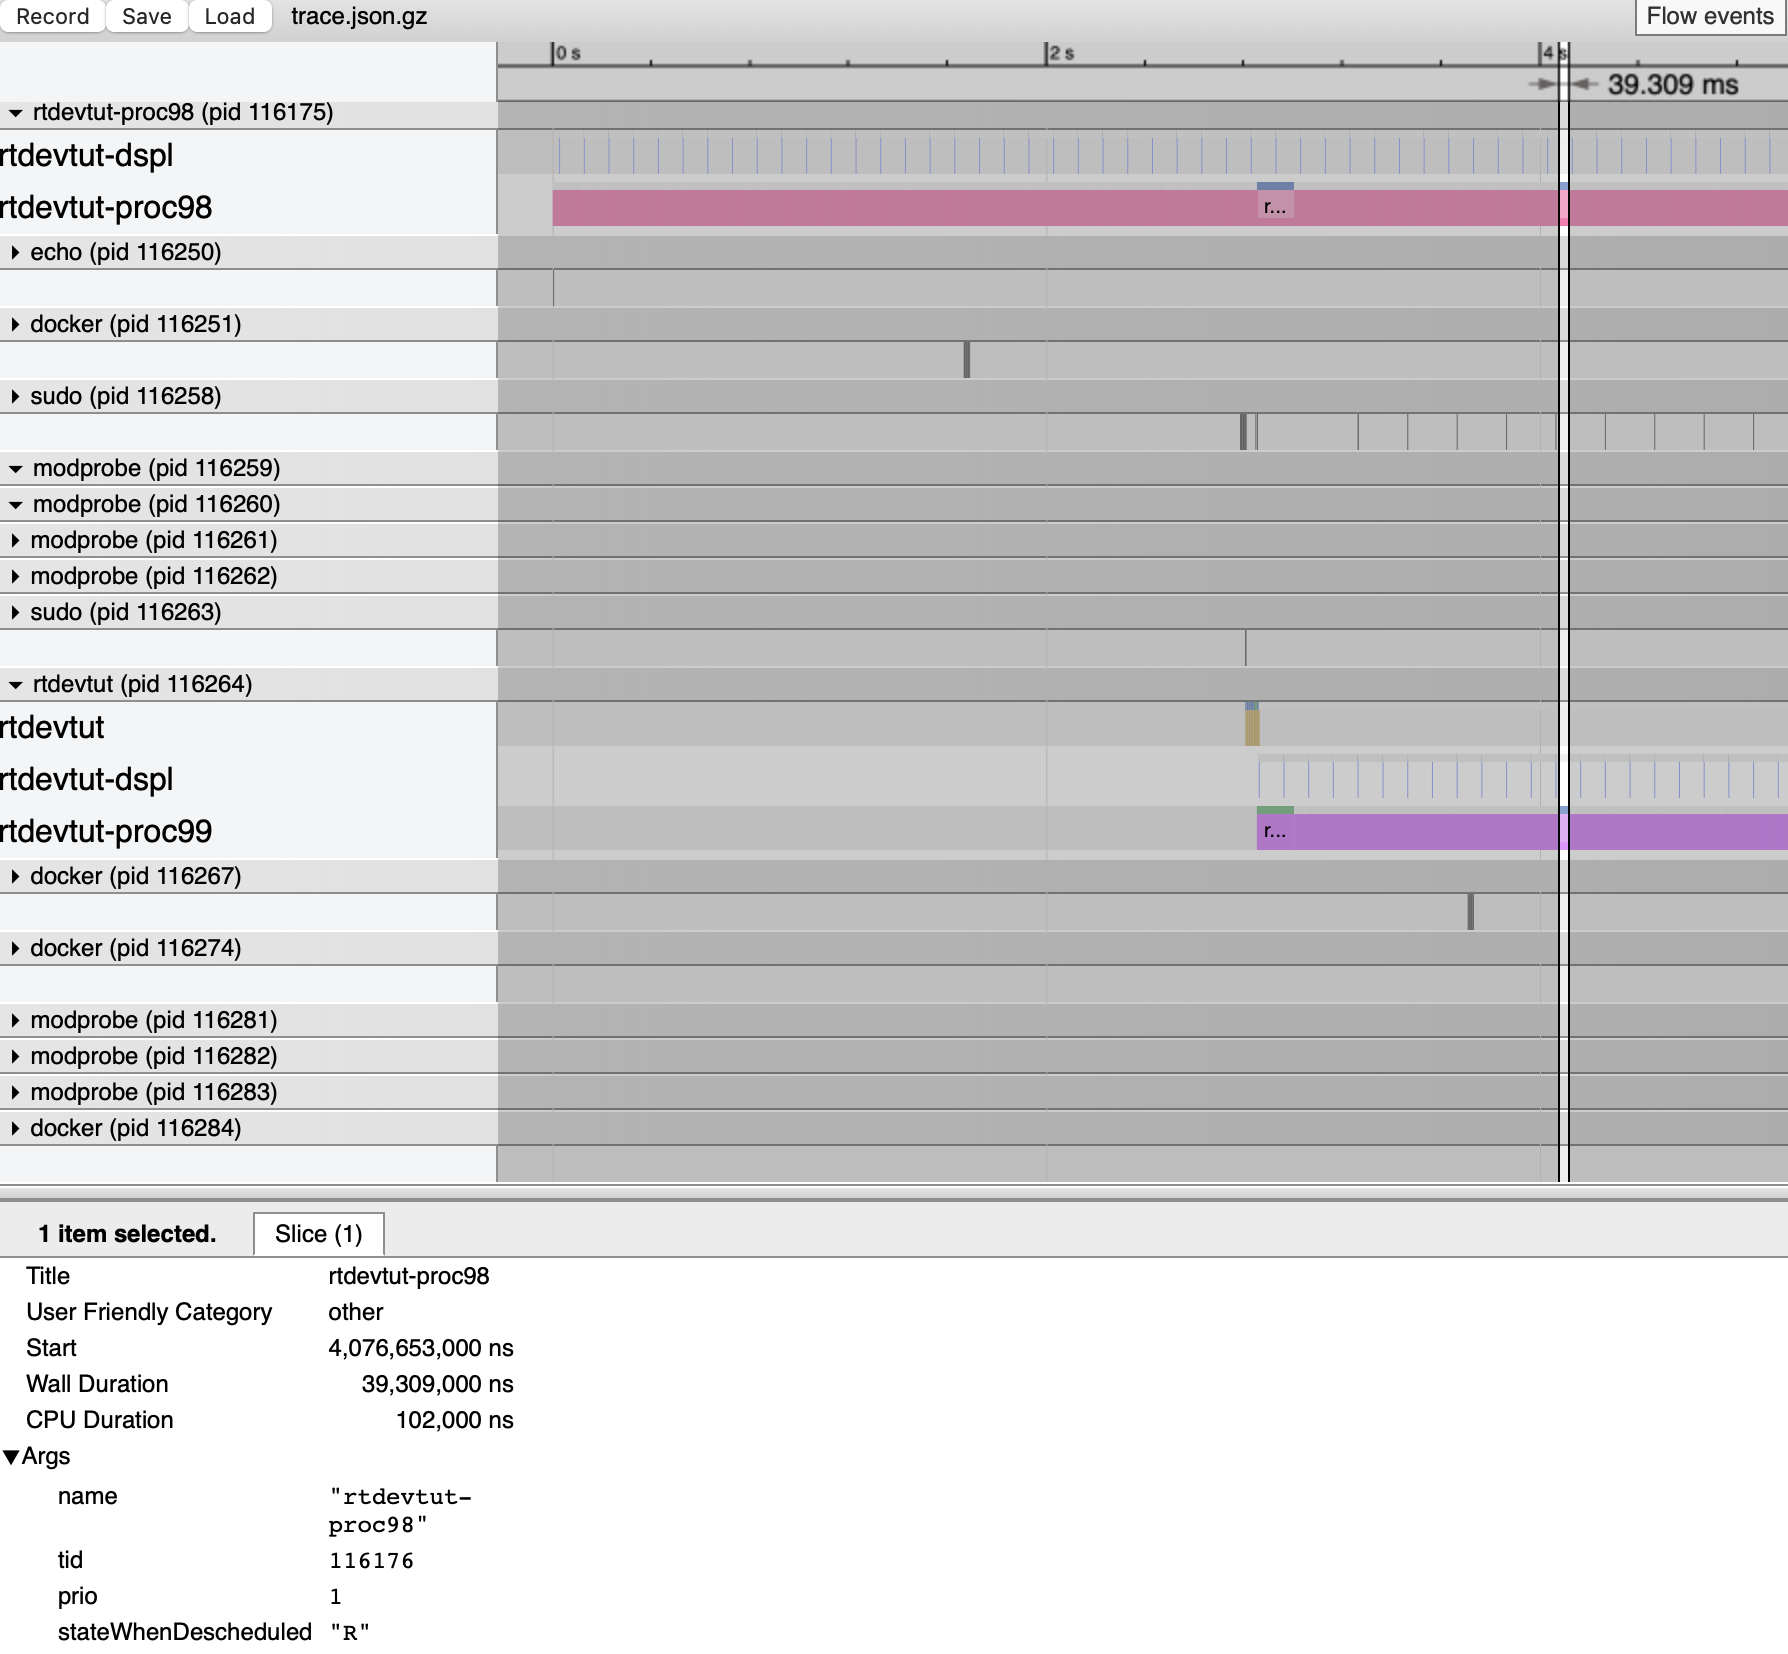
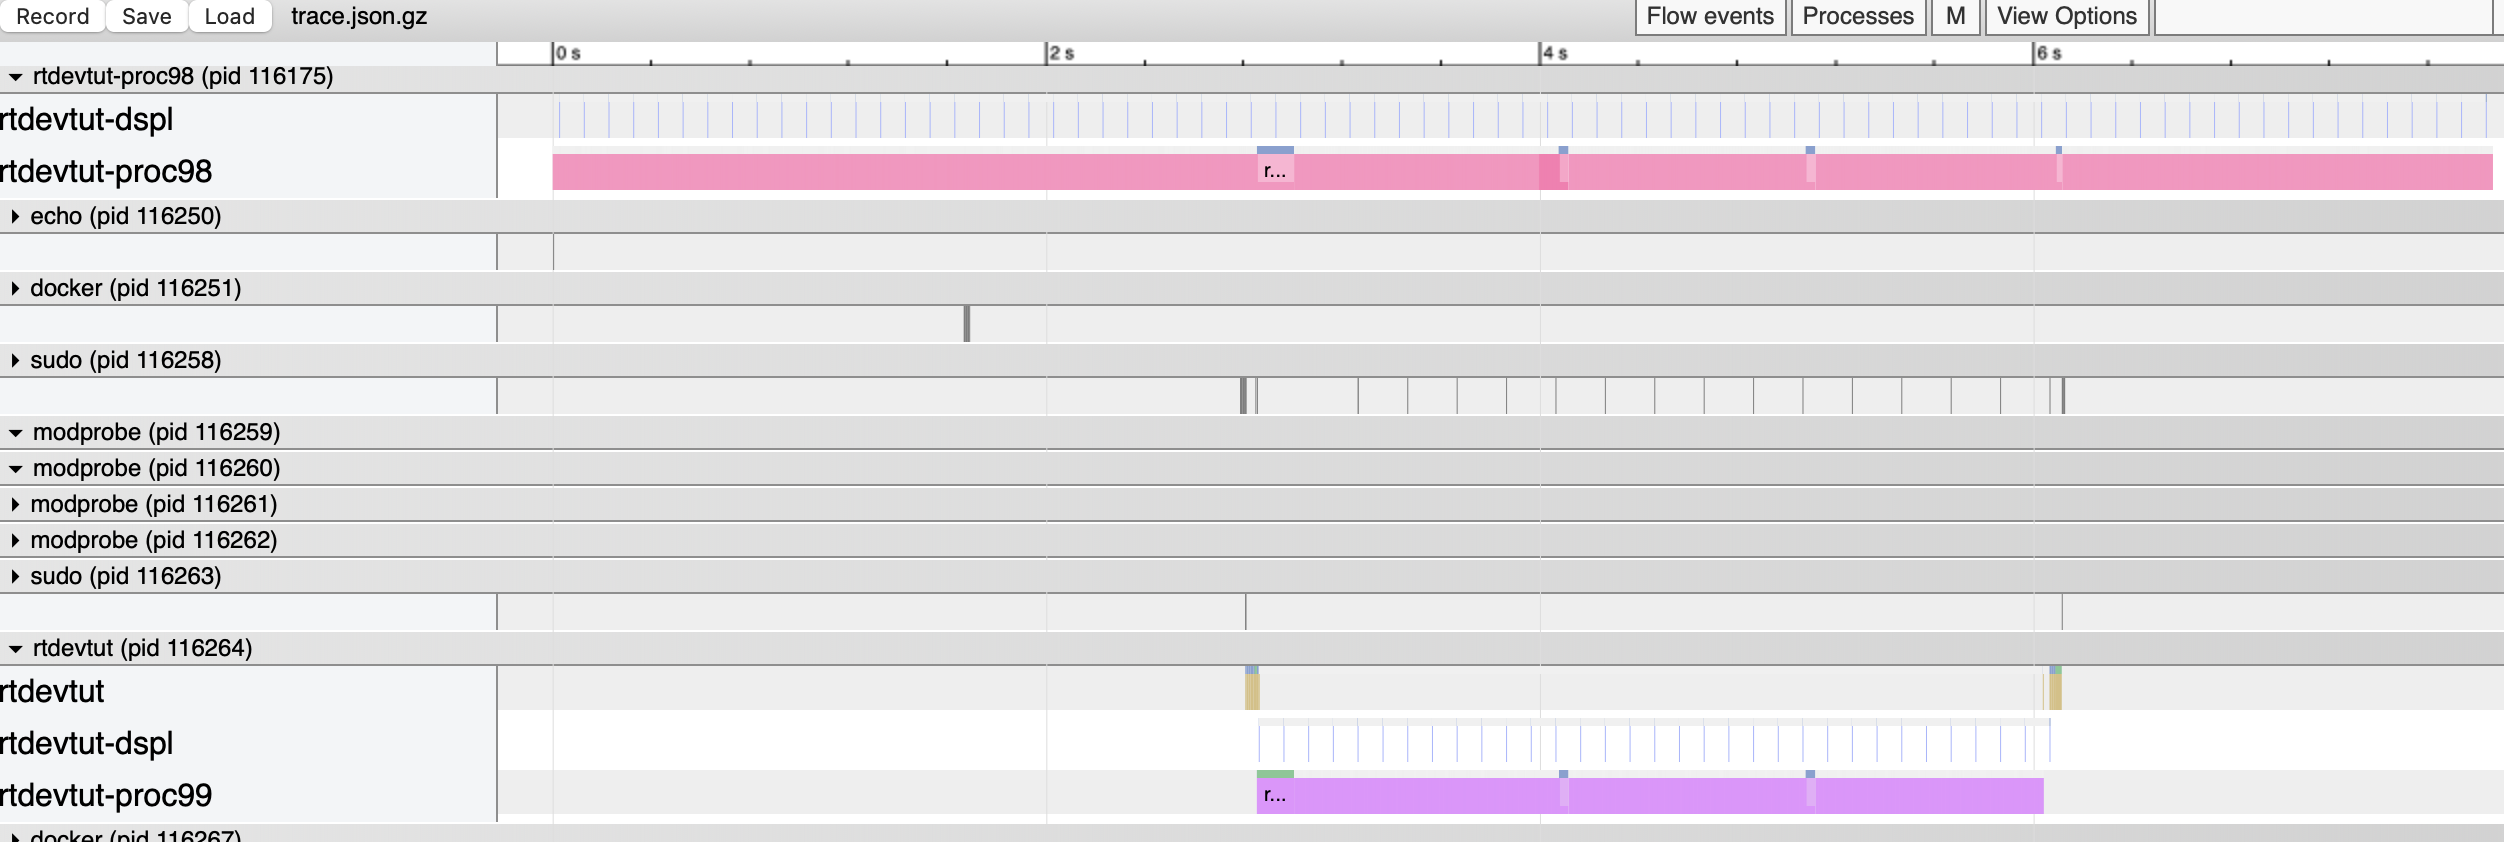
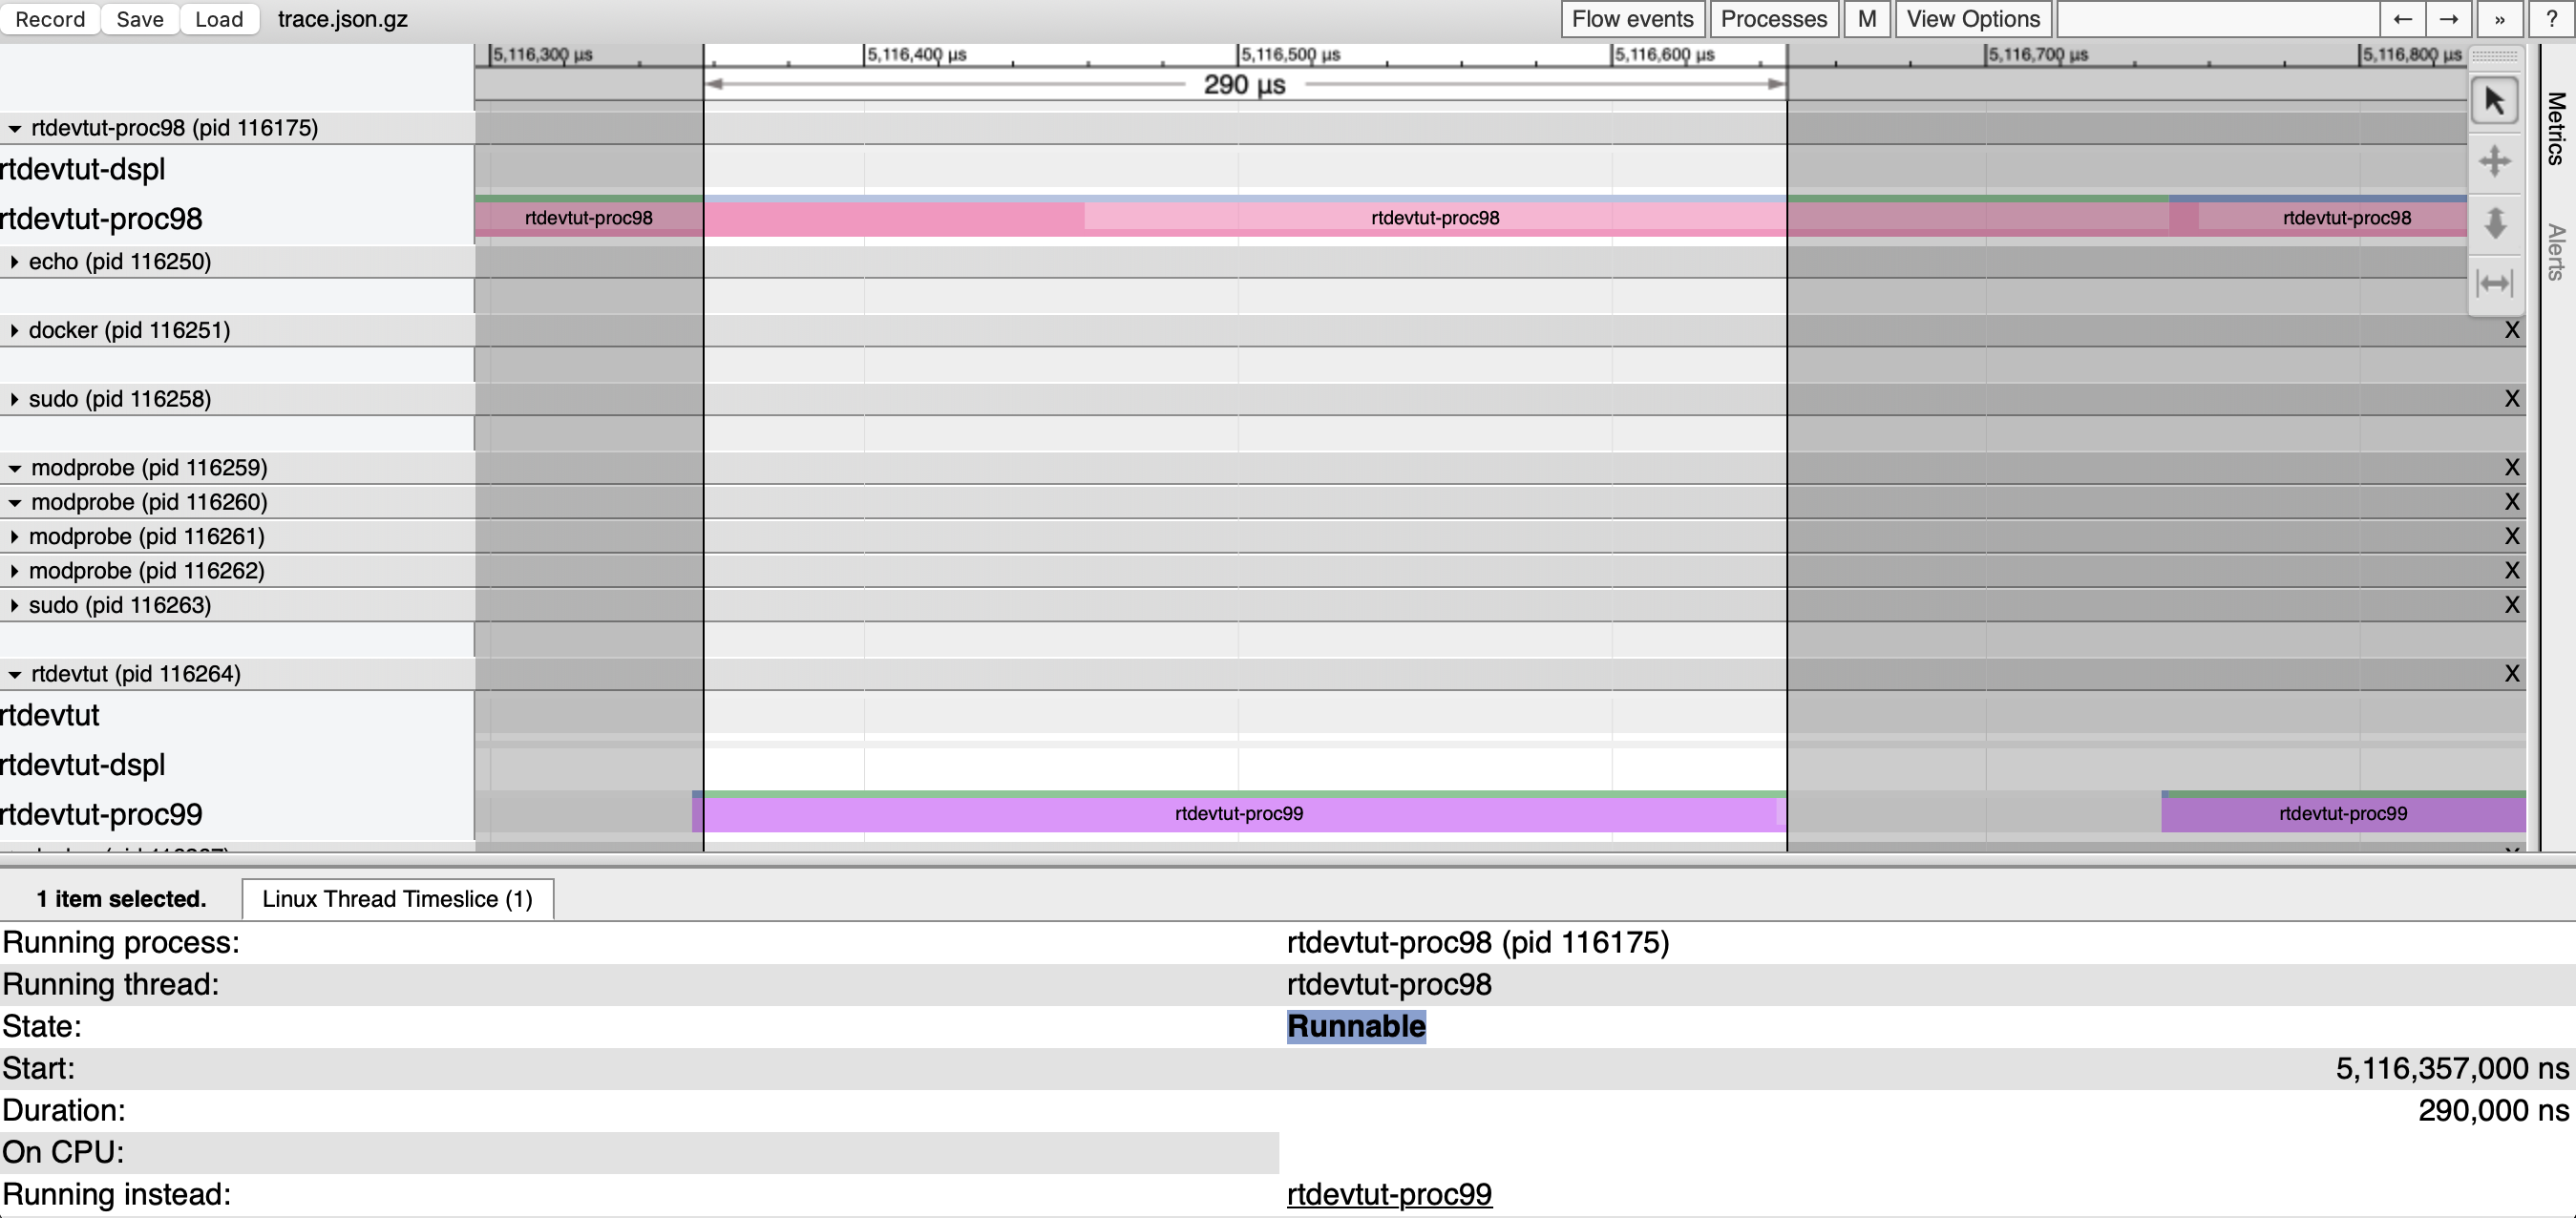
Once the mark is visible the chart may be panned and zoomed to see the detail and context. The figure below show an event that was marked and zoomed in on.
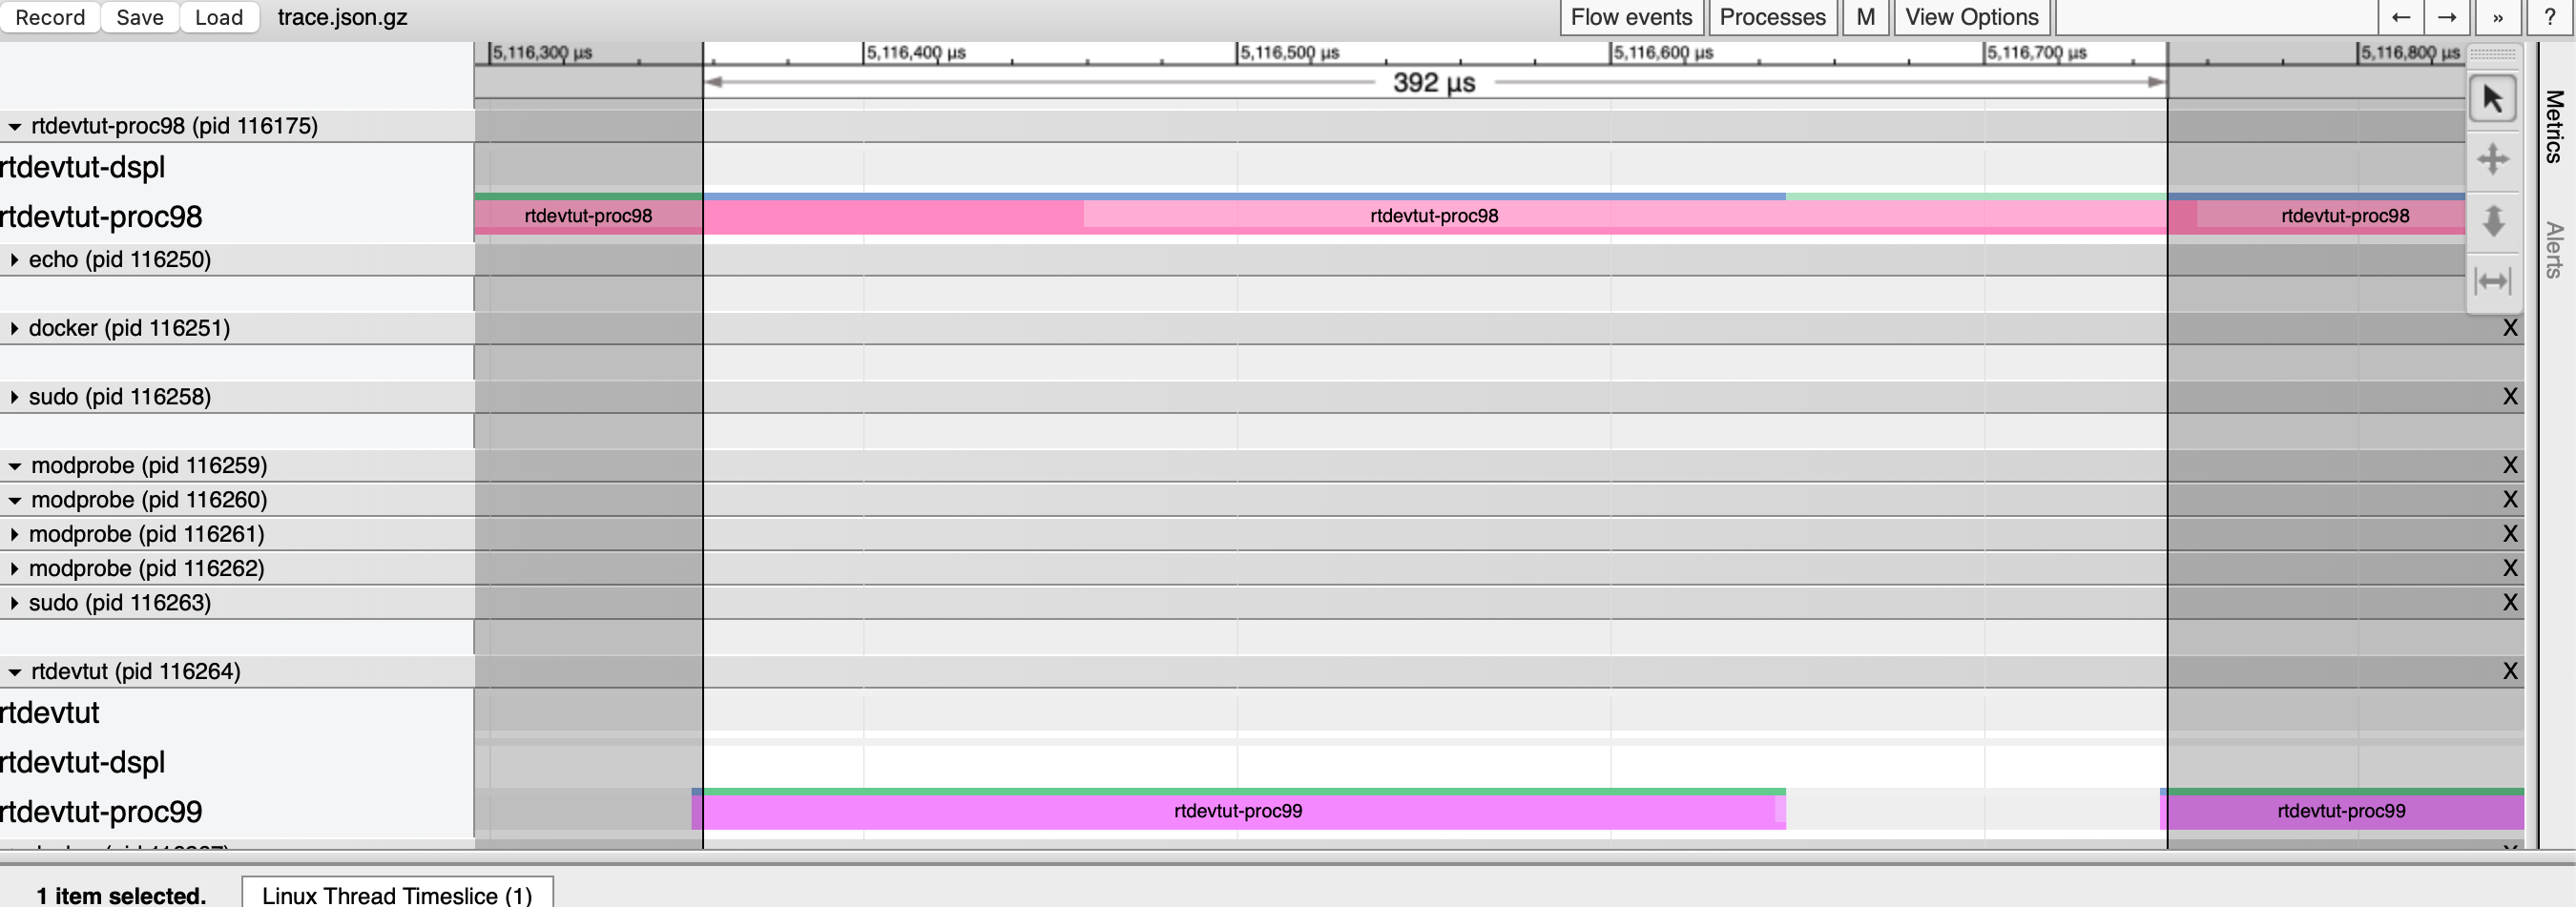
Examine closely rtdevtut-proc98 and you will notice a thin blueish horizontal line right about the larger pink horizontal line. Carefully click on that blueish horizontal line and notice that this thread is in a runnable state, meaning it is attempting to run but is currently being preempted.
Examine closely rtdevtut-proc99 and you will notice a thin blueish-green horizontal lie right about the larger violet horizontal line. Carefully click on that violet horizontal line and notice that this thread is in a running state, meaning it is currently being executed by the CPU.
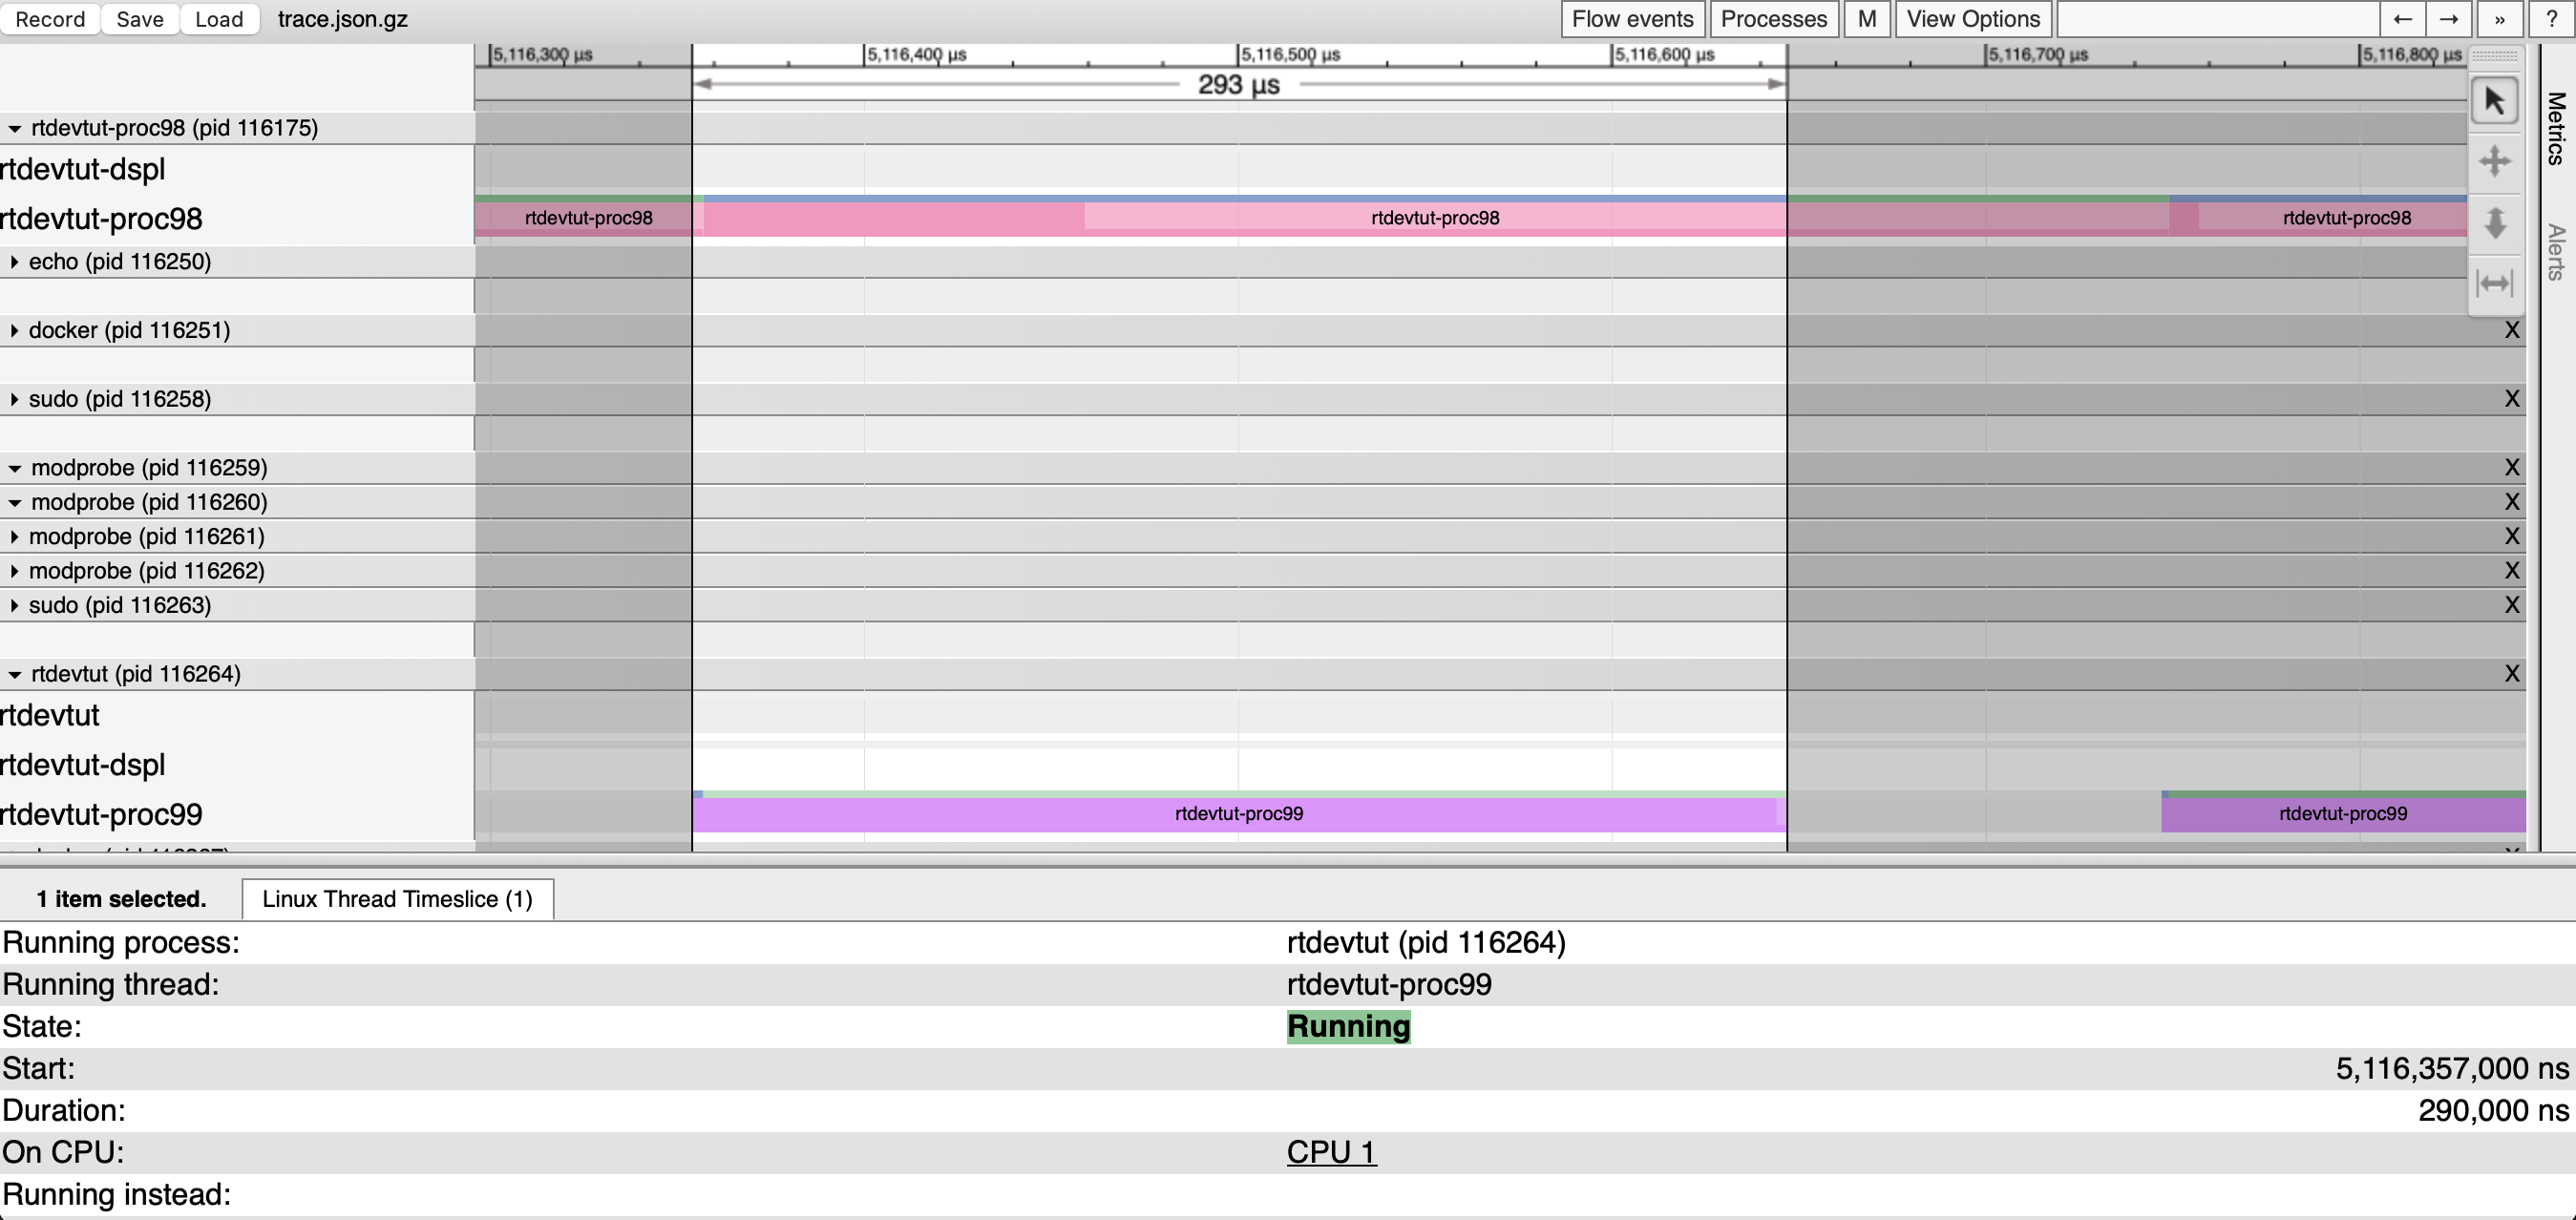
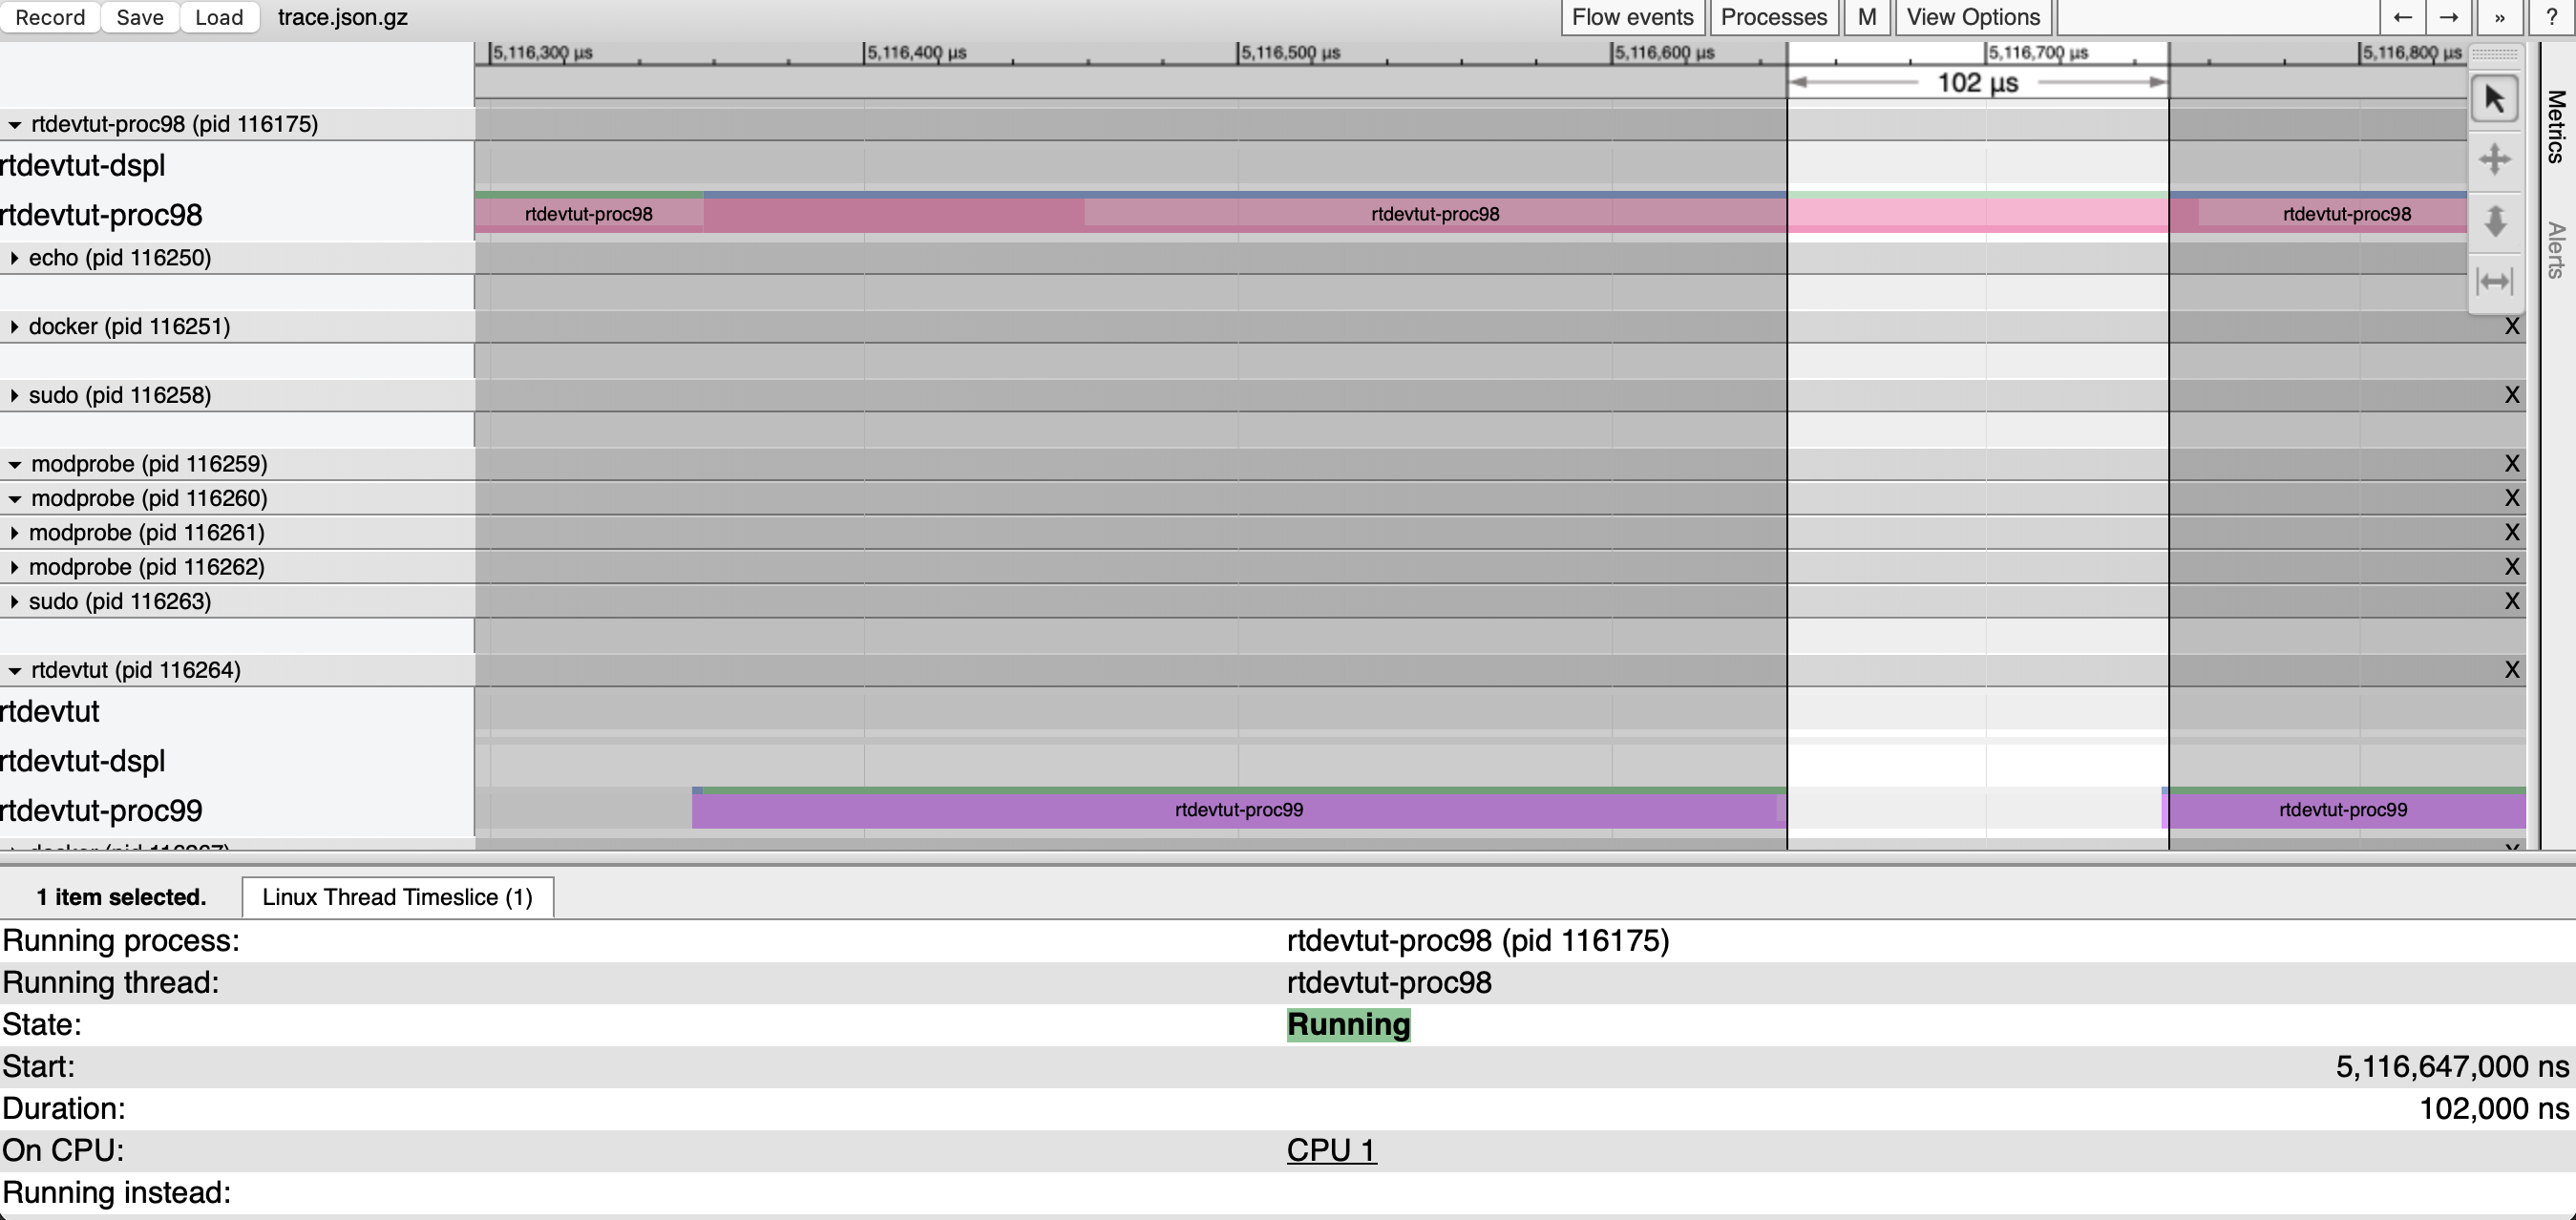
Notice that rtdevtut-proc99 running aligns perfectly with rtdevtut-proc98 runnable meaning that the second, higher priority instance of the tutorial application is preempting the first lower priority instance tutorial application and causing its execution delay. It is only after rtdevtut-proc99 completes that rtdevtut-proc98 is able to return to a running state. Click on the thin blueish-green horizontal line for rtdevtut-proc98 to mark that.
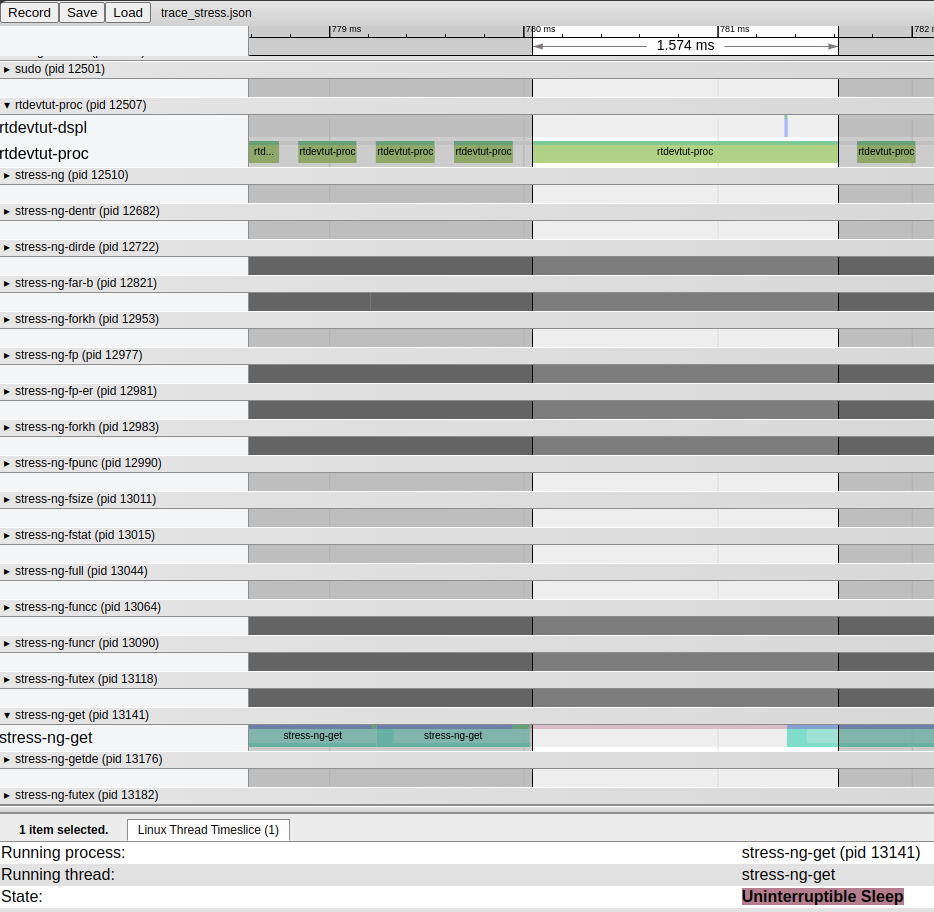
Preemption by the System#
This section shows a brief example of rtdevtut being preempted by the system while the using stress-ng tool.
The stress-ng may be installed using apt:
$ sudo apt install stress-ng
The details of capturing and analyzing the trace will not be repeated here.
Notice how the system has put CPU core 1 into an uninterruptible sleep state which is preempting rtdevtut and causing an outlier to the normal execution cadence.