Tutorials#
These tutorials show how to use the Time Series Analytics microservice.
Tutorial 1: Using default configuration of Time Series Analytics microservice#
In this tutorial, you will learn how to use the default configured UDF for Kapacitor* Microservice. The default configuration is enabled for temperature anomaly detection. The high-level flow of the data is:
MQTT_publisher –> Telegraf* –> Influx –> Kapacitor* –> Influx –> Visualizer
The mqtt_publisher publishes the temperature data over the default topic to Telegraf*. The Telegraf* receives this data using the MQTT input plugin. The Telegraf* sends the data to the Influx and Influx sends it to Kapacitor*. Kapacitor* does anomaly detection and publishes the results back to Influx. The Visualzer uses the InfluxDB data to visualize the anomaly data.
Time to Complete#
15 mins
Learning Objectives#
By the end of this tutorial, you will be able to use the default configured Go Classifier UDF for Kapacitor* Microservice.
Prerequisites#
Getting Started Guide is been followed to install the Time Series Analytics package from ESH.
Step 1: Using default Kapacitor* configurations#
The Kapacitor* uses the <work_dir>/IEdgeInsights/Kapacitor/udfs/py_classifier socket based UDF and <work_dir>/IEdgeInsights/Kapacitor/tick_scripts/py_point_classifier.tick tick script.
The py_classifier.py UDF filters the points based on temperature. The temperature data <20 and >25 filtered out.
The tick_script configuration for the default py_classifier UDF is as below in the <work_dir>/IEdgeInsights/Kapacitor/config.json.
"task": [{
        "tick_script": "py_point_classifier.tick",
             "task_name": "py_point_classifier",
             "udfs": [{
                 "type": "python",
                 "name": "py_classifier"
             },
The <work_dir>/IEdgeInsights/Kapacitor/config/kapacitor.conf file’s UDF section is configured as below to use the <work_dir>/IEdgeInsights/Kapacitor/udfs/py_classifier UDF.
[udf]

# Configuration for UDFs (User Defined Functions)
[udf.functions]
    [udf.functions.py_point_classifier]
      socket = "/tmp/point_classifier"
      timeout = "20s"
The Kapacitor* will use the tick script mentioned in the config.json file and load the UDF based on the configurations done in the kapacitor.conf file.
It will use the datain database and load the point_data to do the processing and will generate the point_classifier_results data that will be sent back to the Influx.
Step 2: Run the Time Series Analytics stack#
Go to the
IEdgeInsights/builddirectory and run the below command to execute the builder script.python3.10 builder.py -f usecases/time-series.yml
Run the below command to bring up the time-series stack.
./run.sh -v -s
Step 3: Verify the Point Classifier Results#
Get the metadata from the InfluxDB* command-line interface:
docker exec -it ia_influxdb bash
influx  -ssl -unsafeSsl -username <username> -password <passwd>
use datain # database access
show measurements
NOTE: The Influx username and password are stored in the
<work_dir>/IEdgeInsights/build/.envfile.To see the data in point_classifier_results measurement, following command are executed:
select * from point_classifier_results
Sample output of the command:
name: point_classifier_results
time                host        temperature        topic                   ts
----                ----        -----------        -----                   --
1714712400630335709 ia_telegraf 18.42068584205347  temperature/simulated/0 1714712400.6293523
1714712402633395511 ia_telegraf 14.391666902270547 temperature/simulated/0 1714712402.6324484
1714712403634973589 ia_telegraf 27.23652018773963  temperature/simulated/0 1714712403.6340005
1714712404636530813 ia_telegraf 19.702333951727223 temperature/simulated/0 1714712404.6355455
1714712405638060884 ia_telegraf 25.718890285952945 temperature/simulated/0 1714712405.6370773
1714712406639748344 ia_telegraf 28.198741303961505 temperature/simulated/0 1714712406.6386988
1714712407641263580 ia_telegraf 13.610311890999036 temperature/simulated/0 1714712407.6403072
1714712408642867052 ia_telegraf 17.36123678886323  temperature/simulated/0 1714712408.641851
1714712410645019574 ia_telegraf 28.62810476767336  temperature/simulated/0 1714712410.6446784
1714712413650250031 ia_telegraf 14.655651446086281 temperature/simulated/0 1714712413.6492639
1714712414652007643 ia_telegraf 13.61691966743156  temperature/simulated/0 1714712414.6510036
1714712415652423705 ia_telegraf 13.018084337291976 temperature/simulated/0 1714712415.6521113
You can see that
point_classifier_resultshas the data points with temperature > 25 and < 20.Complete the following steps to use Visualizer’s Grafana:
Use link
https://<host_ip>:3000to launch Visualizer’s Grafana from browser.Use root as the Username and eii123 as the Password both for first login, password can be changed if required when prompted after logging in.
On the Home Dashboard page, on the left corner, click the Dashboards icon.
Click the Manage Dashboards tab, to view the list of all the preconfigured dashboards.
Select EII Video and Time Series Dashboard, to view multiple panels with topic names of the subscriber as the panel names along with a time-series panel named
Time Series.Hover over the topic name. The panel title will display multiple options.
Click View to view the subscribed frames for each topic.
You will see the below output with the default configurations for time series use case.
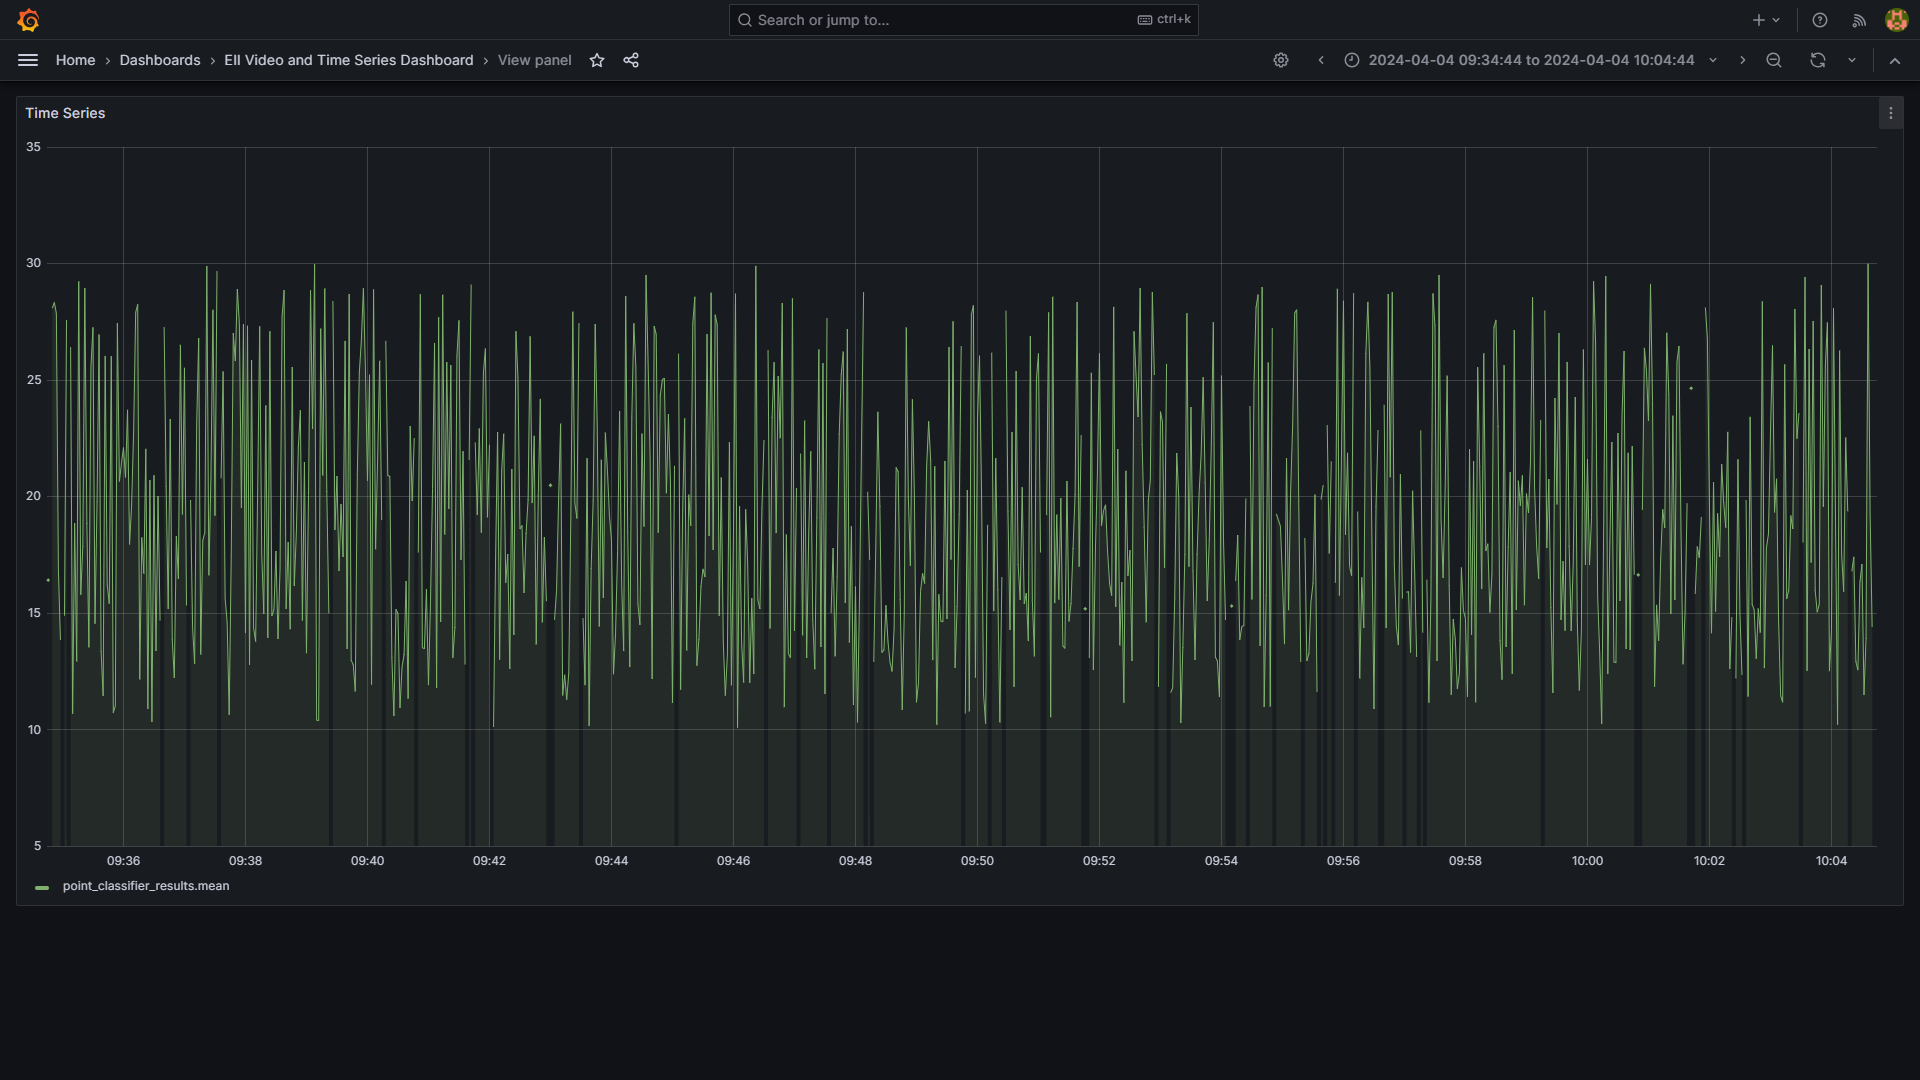
Here in the InfluxDB and on the Visualizer time-series point_classifier_results tab, you will see the data points with temperature > 25 and < 20.
Summary#
In this tutorial, you learned how to use the default Go Classifier UDF for the Time Series Analytics Microservice.
Tutorial 2: Steps to Configure Process based rfc_classifier UDF#
Time to Complete#
30 min
Learning Objectives#
By the end of this tutorial, you will be able to configure Process based
<work_dir>/IEdgeInsights/Kapacitor/udfs/rfc_classifier.pyUDF for Time Series Analytics Microservice.
Prerequisites#
Getting Started Guide is been followed to install the Time Series Analytics package from ESH.
Ensure that docker ps is clean and docker network ls does not have Intel® Edge Insights System bridge network.
Step 1: Configure the mqtt_publisher#
Do the the below changes to the command section in docker-compose.yml file present in the <work_dir>/IEdgeInsights/tools/mqtt/publisher/ directory.
["--topic", "test/rfc_data", "--json", "./json_files/*.json", "--streams", "1"]
Step 2: Configure the UDF#
Configure the UDF in
<work_dir>/IEdgeInsights/Kapacitor/config/kapacitor.conf file. Mention therfc_classifierUDF in the configuration, for example:[udf.functions.rfc] prog = "python3" args = ["-u", "/EII/udfs/rfc_classifier.py"] timeout = "60s" [udf.functions.rfc.env] PYTHONPATH = "/go/src/github.com/influxdata/kapacitor/udf/agent/py/:/EII/.local/lib/python3.10/site-pack<work_dir>/IEdgeInsights/Kapacitor/ages/:/opt/conda/envs/env/lib/python3.10/site-packages/"
Configure the UDF in config.json file
For python based UDF, update the values of keys named “type”, “name”, “tick_script”, “task_name”, in the
<work_dir>/IEdgeInsights/Kapacitor/config.jsonfile, for example:"task": [{ "tick_script": "rfc_task.tick", "task_name": "rfc_task", "udfs": [{ "type": "python", "name": "rfc_classifier" }] }]
The Kapacitor* will use the tick script mentioned in the config.json file and load the UDF based on the configurations done in the kapacitor.conf file.
It will use the datain database and load the ts_data to do the processing and will generate the rfc_results data that will be sent back to the Influx.
Step 3: Run the Time Series Analytics stack#
Go to the
IEdgeInsights/builddirectory and run the below command to execute the builder script.python3.10 builder.py -f usecases/time-series.yml
Run the below command to bring up the time-series stack.
./run.sh -v -s
Step 4: Verify the rfc_classifier Results#
Get the metadata from the InfluxDB* command-line interface:
docker exec -it ia_influxdb bash
influx -username <username> -password <passwd>
use datain # database access
show measurements
To see the data in rfc_results measurement, following command are executed:
select * from rfc_results
Sample output of the command:
name: rfc_results
time                assetId host        prediction topic
----                ------- ----        ---------- -----
1710743558243513255 ROB1-1  ia_telegraf 1          test/rfc_data
1710743559245885651 ROB1-1  ia_telegraf 1          test/rfc_data
1710743560247412191 ROB1-1  ia_telegraf 1          test/rfc_data
1710743561248955691 ROB1-1  ia_telegraf 1          test/rfc_data
1710743562250818847 ROB1-1  ia_telegraf 1          test/rfc_data
1710743563252207189 ROB1-1  ia_telegraf 1          test/rfc_data
1710743564253989934 ROB1-1  ia_telegraf 1          test/rfc_data
1710743565255566109 ROB1-1  ia_telegraf 1          test/rfc_data
1710743566257059617 ROB1-1  ia_telegraf 1          test/rfc_data
1710743567257823866 ROB1-1  ia_telegraf 1          test/rfc_data
1710743568260378557 ROB1-1  ia_telegraf 1          test/rfc_data
1710743569261891034 ROB1-1  ia_telegraf 1          test/rfc_data
1710743570263332662 ROB1-1  ia_telegraf 1          test/rfc_data
To check the output in Visualizer’s Grafana, follow the below steps.
Use link
https://<host_ip>:3000to launch Visualizer’s Grafana from browser.Login to the Visualizer’s Grafana and select EII Video and Time Series Dashboard.
Click on the
Editoption for theTime Seriespanel as shown below.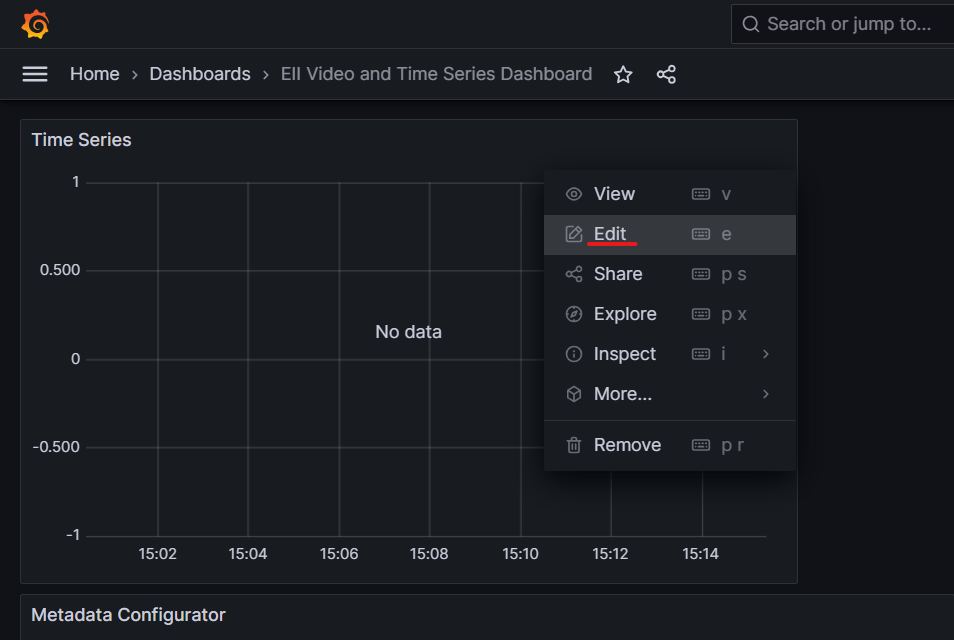
Select the
rfc_resultsandfield(prediction)option from the drop down for theFROMandSELECTfields. Click on theApplybutton to apply the changes.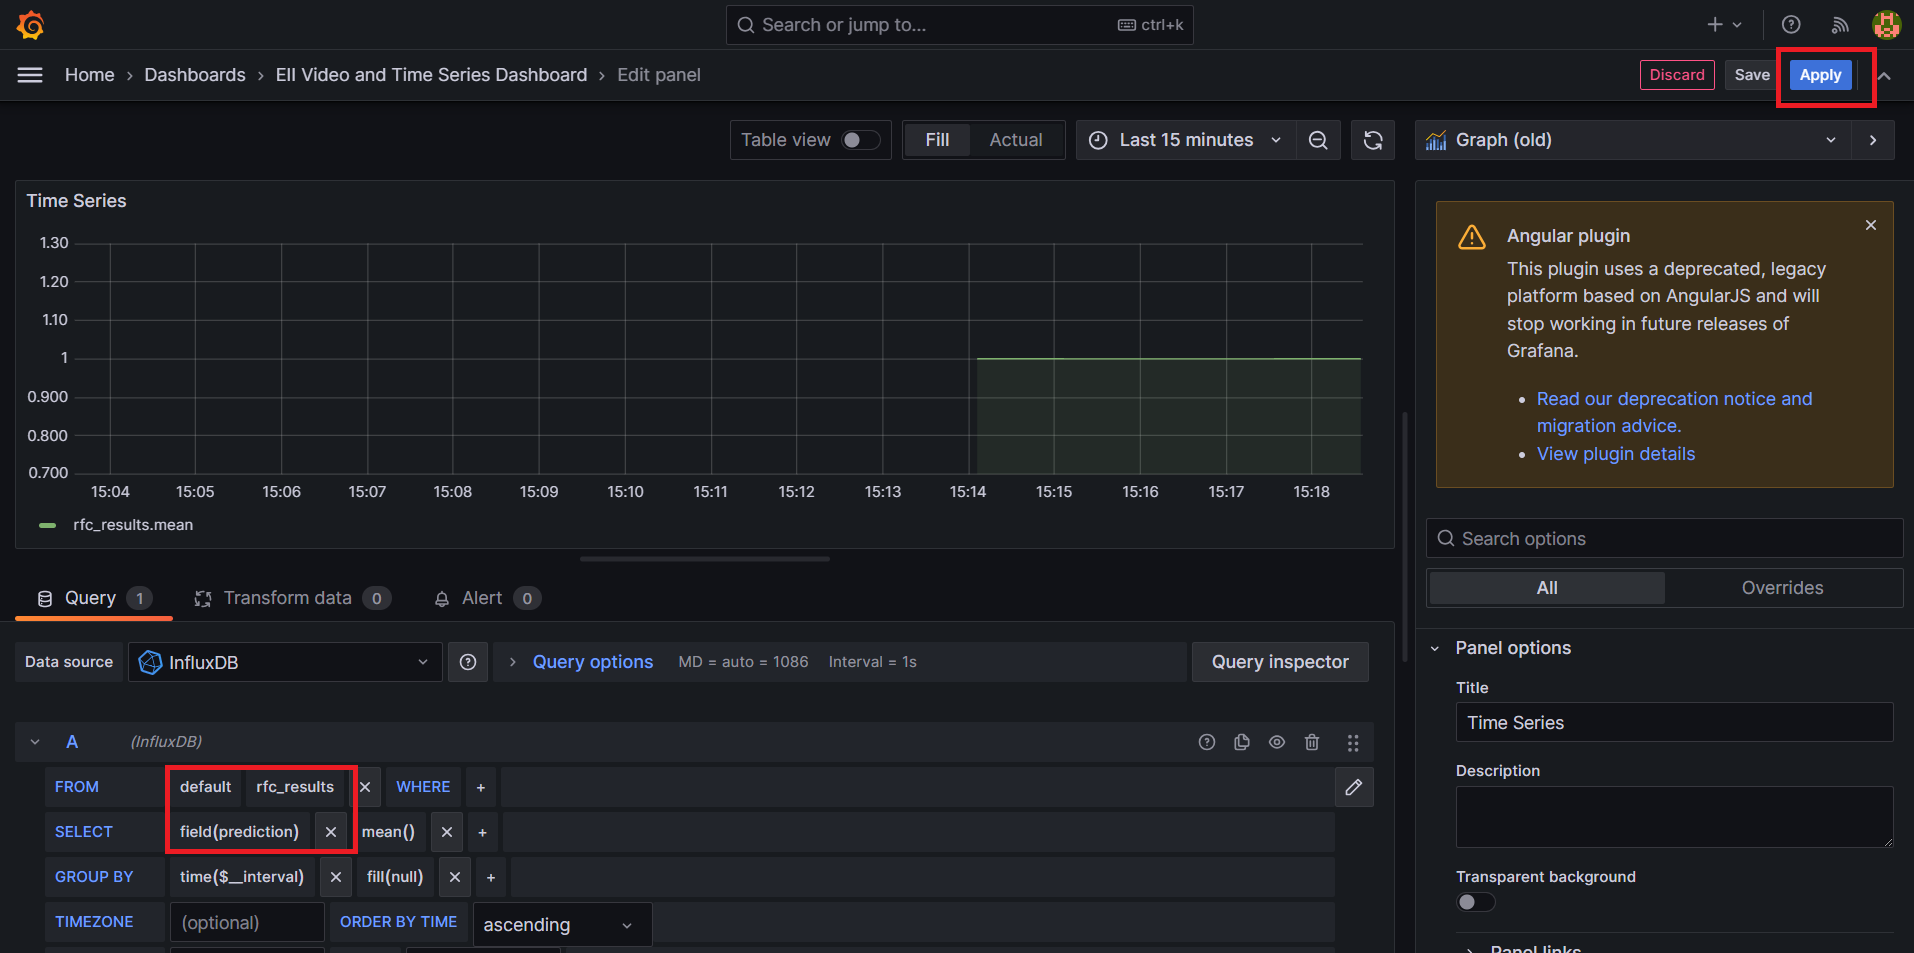
You will see the below output for the
rfc_classifierfor Time Series Analytics use case.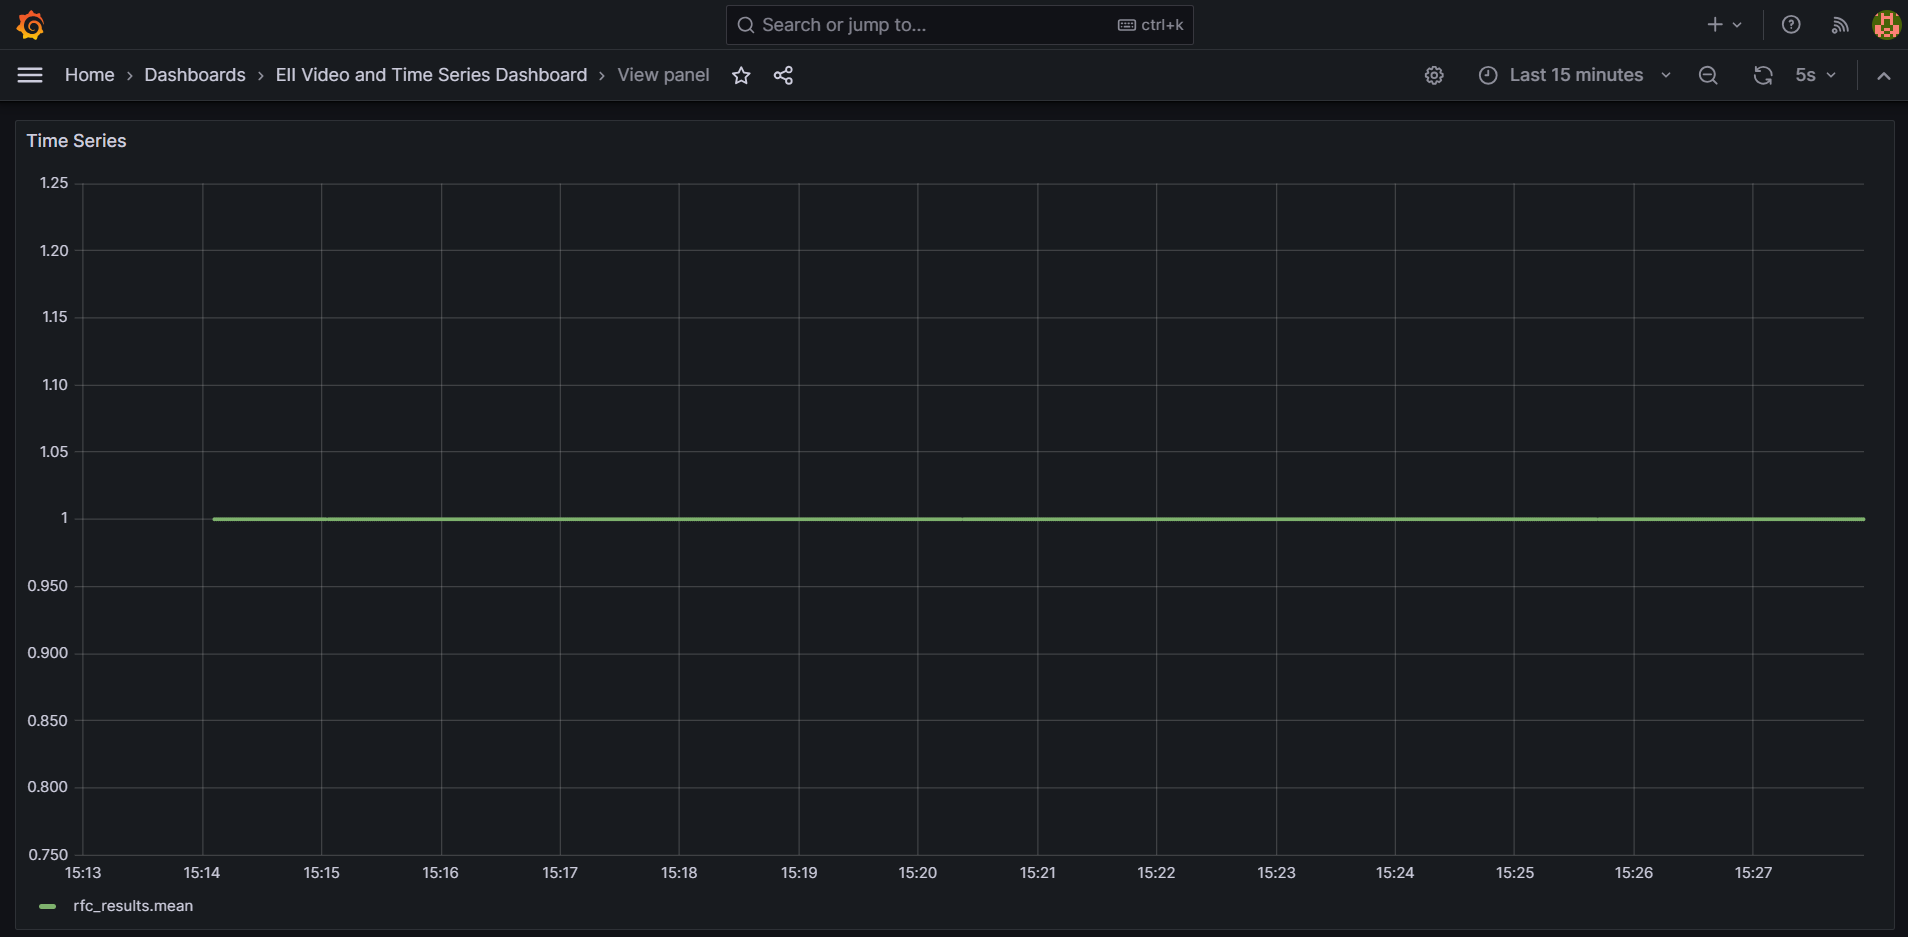
Summary#
In this tutorial, you learned how to configure Process based rfc_classifier UDF for Time Series Analytics Microservice.
Learn More#
Understand the components, services, architecture, and data flow, in the Overview.