Get Started#
Time to Complete: 30 minutes
Programming Language: Python 3
Prerequisites#
Configure and update the environment variables#
Update the below fields in
.envfile present at the root of the repository.HOST_IP= # replace localhost with system IP example: HOST_IP=10.100.100.100 MR_PSQL_PASSWORD= # example: MR_PSQL_PASSWORD=intel1234 MR_MINIO_ACCESS_KEY= # example: MR_MINIO_ACCESS_KEY=intel1234 MR_MINIO_SECRET_KEY= # example: MR_MINIO_SECRET_KEY=intel1234 http_proxy= # example: http_proxy=http://proxy.example.com:891 https_proxy= # example: http_proxy=http://proxy.example.com:891 MTX_WEBRTCICESERVERS2_0_USERNAME= # example: MTX_WEBRTCICESERVERS2_0_USERNAME=myuser MTX_WEBRTCICESERVERS2_0_PASSWORD= # example: MTX_WEBRTCICESERVERS2_0_PASSWORD=mypassword
Update HOST_IP_where_MRaaS_is_running in
config.jsonfile present in the repository inside theconfigsfolder."model_registry": { "url": "http://<HOST_IP_where_MRaaS_is_running>:32002", "request_timeout": 300, "saved_models_dir": "./mr_models" },
Run multiple AI pipelines#
Follow this procedure to run the sample application. In a typical deployment, multiple cameras deliver video streams that are connected to AI pipelines to improve the classification and recognition accuracy.
Bring up the containers.
docker compose up -d
Start the weld porosity classification pipeline with the following Client URL (cURL) command by replacing the
<peer-str-id>with a string id eg:weldand with<HOST_IP>set to system IP. This pipeline is configured to run in a loop forever. This REST/cURL request will return a pipeline instance ID, which can be used as an identifier to query later the pipeline status or stop the pipeline instance. For example, a6d67224eacc11ec9f360242c0a86003.curl http://<HOST_IP>:8080/pipelines/user_defined_pipelines/weld_porosity_classification_mlops -X POST -H 'Content-Type: application/json' -d '{ "destination": { "frame": { "type": "webrtc", "peer-id": "<peer-str-id>" } }, "parameters": { "classification-properties": { "model": "/home/pipeline-server/resources/models/weld_porosity/weld_porosity_classification/deployment/Classification/model/model.xml", "device": "CPU" } } }'
Start another weld porosity classification pipeline with the following Client URL (cURL) command by replacing the
<different-peer-str-id>with a different string id than the one in above step. eg:weldstreamand with<HOST_IP>set to system IP. This pipeline is not configured to run in a loop forever. This REST/cURL request will return a pipeline instance ID, which can be used as an identifier to query later the pipeline status or stop the pipeline instance. For example, a6d67224eacc11ec9f360242c0a86003.curl http://<HOST_IP>:8080/pipelines/user_defined_pipelines/weld_porosity_classification -X POST -H 'Content-Type: application/json' -d '{ "source": { "uri": "file:///home/pipeline-server/resources/videos/welding.avi", "type": "uri" }, "destination": { "frame": { "type": "webrtc", "peer-id": "<different-peer-str-id>" } }, "parameters": { "classification-properties": { "model": "/home/pipeline-server/resources/models/weld_porosity/weld_porosity_classification/deployment/Classification/model/model.xml", "device": "CPU" } } }'
Note: Note the instance ID of this pipeline
View the WebRTC streaming on
http://<HOST_IP>:<mediamtx-port>/<peer-str-id>andhttp://<HOST_IP>:<mediamtx-port>/<different-peer-str-id>.mediamtx-portin this case would be 8889 as configured in .env file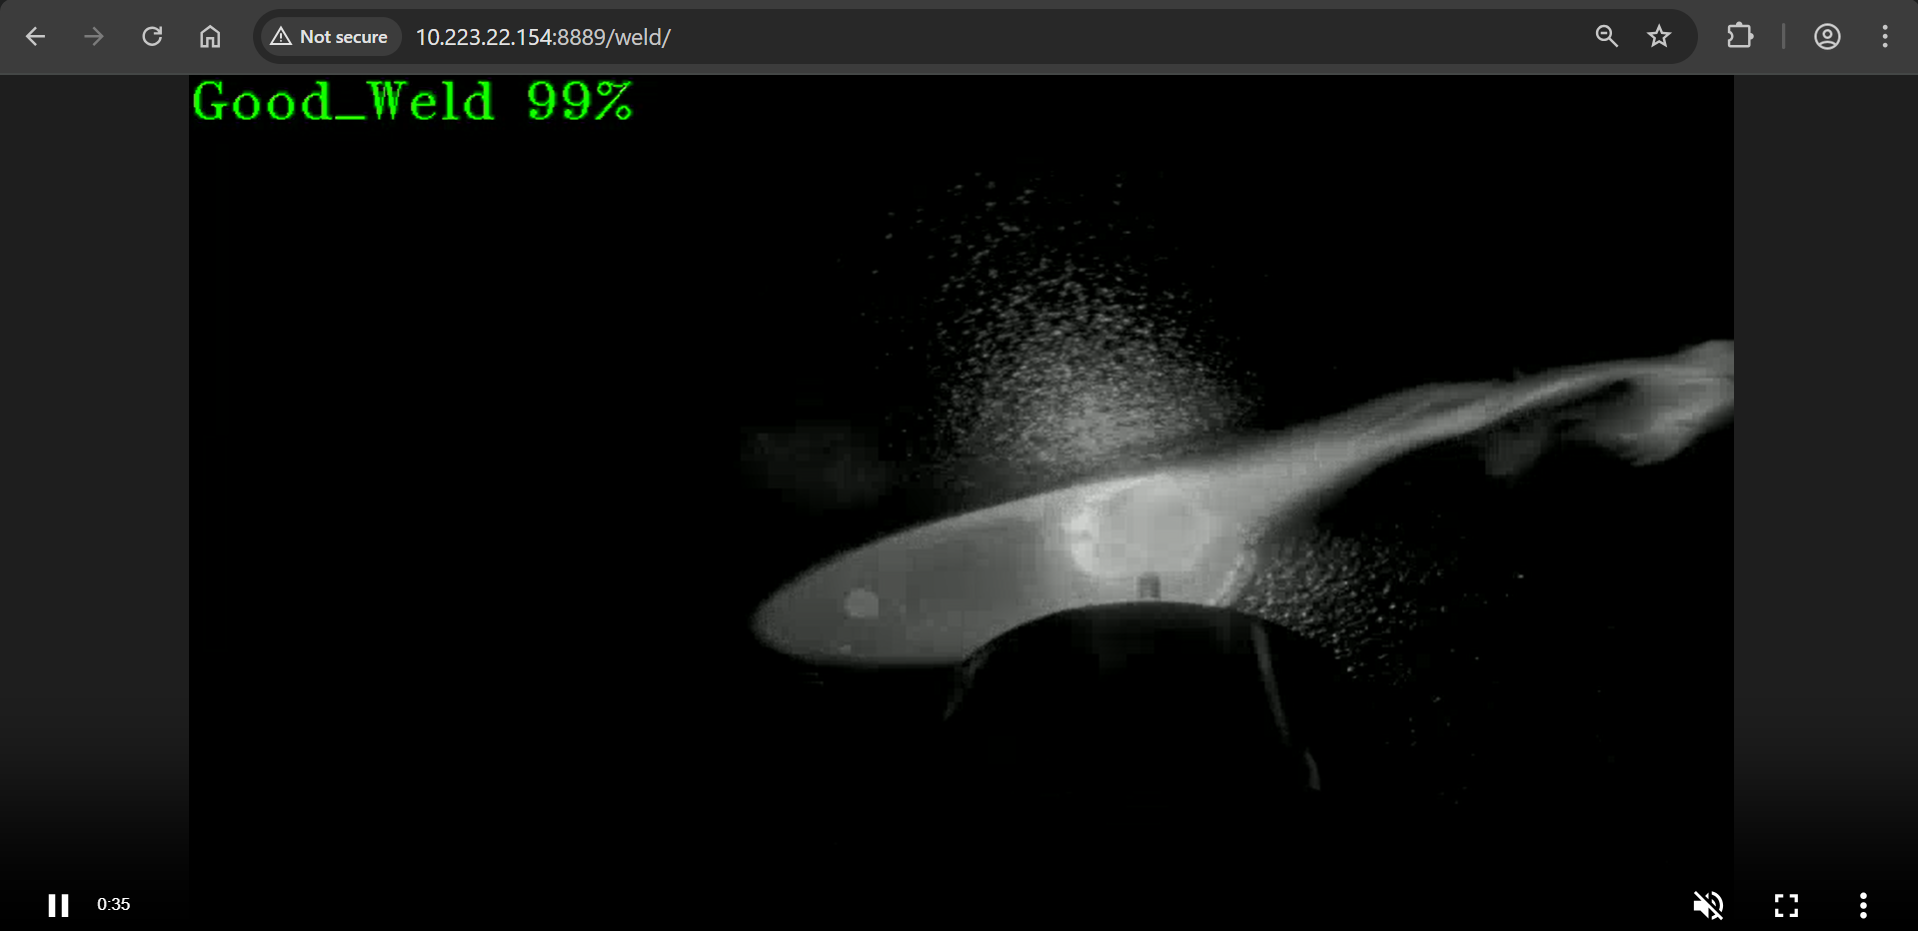
Figure 1: WebRTC streaming
You can view the welding video, where each frame is categorized by the percentage of Good_Weld, Porosity, and No_Weld.
Stop the 2nd pipeline using the instance ID noted in point #3 above, before proceeding with this documentation.
curl --location -X DELETE http://<HOST_IP>:8080/pipelines/{instance_id}
MLOps Flow: At runtime, download a new model from model registry and restart the pipeline with the new model.#
Note: We have removed "model-instance-id=inst0" from the weld_porosity_classification_mlops pipeline in config.json to ensure the proper loading of the new AI model in the MLOps flow. However, as a general rule, keeping "model-instance-id=inst0" in a pipeline is recommended for better performance if you are running multiple instances of the same pipeline.
Get all the registered models in the model registry
curl -X GET 'http://<HOST_IP>:32002/models'
The following step demonstrates how to create a sample model file from an existing model folder for uploading to the Model Registry. If you already have a model zip file, you can skip this step.
 cd <weld_porosity_sample_application_repo_workdir>/resources/models/weld_porosity/weld_porosity_classification
 zip -r ../weld_porosity_classification.zip .
You can utilize the generated
<path>/weld_porosity_classification.zipas<model_file_path.zip>in the next stepUpload a model file to Model Registry
curl -L -X POST "http://<HOST_IP>:32002/models" \
-H 'Content-Type: multipart/form-data' \
-F 'name="YOLO_Test_Model"' \
-F 'precision="fp32"' \
-F 'version="v1"' \
-F 'origin="Geti"' \
-F 'file=@<model_file_path.zip>;type=application/zip' \
-F 'project_name="weld-porosity-classification"' \
-F 'architecture="YOLO"' \
-F 'category="Classification"'
Check instance ID of currently running pipeline and use it in the next command
curl --location -X GET http://<HOST_IP>:8080/pipelines/status
Download the files for a specific model from the model registry microservice and restart the running pipeline with the new model. Essentially, the running instance gets aborted and a new instance gets started.
curl 'http://<HOST_IP>:8080/pipelines/user_defined_pipelines/weld_porosity_classification_mlops/<instance_id_of_currently_running_pipeline>/models' \
--header 'Content-Type: application/json' \
--data '{
     "project_name": "weld-porosity-classification",
     "version": "v1",
     "category": "Classification",
     "architecture": "YOLO",
     "precision": "fp32",
     "deploy": true,
     "pipeline_element_name": "classification",
     "origin": "Geti",
     "name": "YOLO_Test_Model"
}'
Note: The data above assumes there is a model in the registry that contains these properties. Note: The pipeline name that follows user_defined_pipelines, will affect the
deploymentfolder name.View the WebRTC streaming on
http://<HOST_IP>:<mediamtx-port>/<peer-str-id>by replacing<peer-str-id>with the value used in the cURL command to start the pipeline with<HOST_IP>set to system IP.Figure 2: WebRTC streaming
You can also stop any running pipeline by using the pipeline instance “id”
curl --location -X DELETE http://<HOST_IP>:8080/pipelines/{instance_id}
DL Streamer Pipeline Server S3 frame storage#
Follow this procedure to test the DL Streamer Pipeline Server S3 storage using the docker.
Install the pip package boto3 once if not installed with the following command
pip3 install boto3==1.36.17
Create a S3 bucket using the following script.
import boto3
url = "http://<HOST_IP>:8000"
user = "<value of MR_MINIO_ACCESS_KEY used in .env>"
password = "<value of MR_MINIO_SECRET_KEY used in .env>"
bucket_name = "ecgdemo"

client= boto3.client(
            "s3",
            endpoint_url=url,
            aws_access_key_id=user,
            aws_secret_access_key=password
)
client.create_bucket(Bucket=bucket_name)
buckets = client.list_buckets()
print("Buckets:", [b["Name"] for b in buckets.get("Buckets", [])])
Start the pipeline with the following cURL command with
<HOST_IP>set to system IP. Ensure to give the correct path to the model as seen below. This example starts an AI pipeline.curl http://<HOST_IP>:8080/pipelines/user_defined_pipelines/weld_porosity_classification_s3write -X POST -H 'Content-Type: application/json' -d '{ "source": { "uri": "file:///home/pipeline-server/resources/videos/welding.avi", "type": "uri" }, "destination": { "frame": { "type": "webrtc", "peer-id": "welds3" } }, "parameters": { "classification-properties": { "model": "/home/pipeline-server/resources/models/weld_porosity/weld_porosity_classification/deployment/Classification/model/model.xml", "device": "CPU" } } }'
Go to MinIO console on
http://<HOST_IP>:8000/and login withMR_MINIO_ACCESS_KEYandMR_MINIO_SECRET_KEYprovided in.envfile. After logging into console, you can go toecgdemobucket and check the frames stored.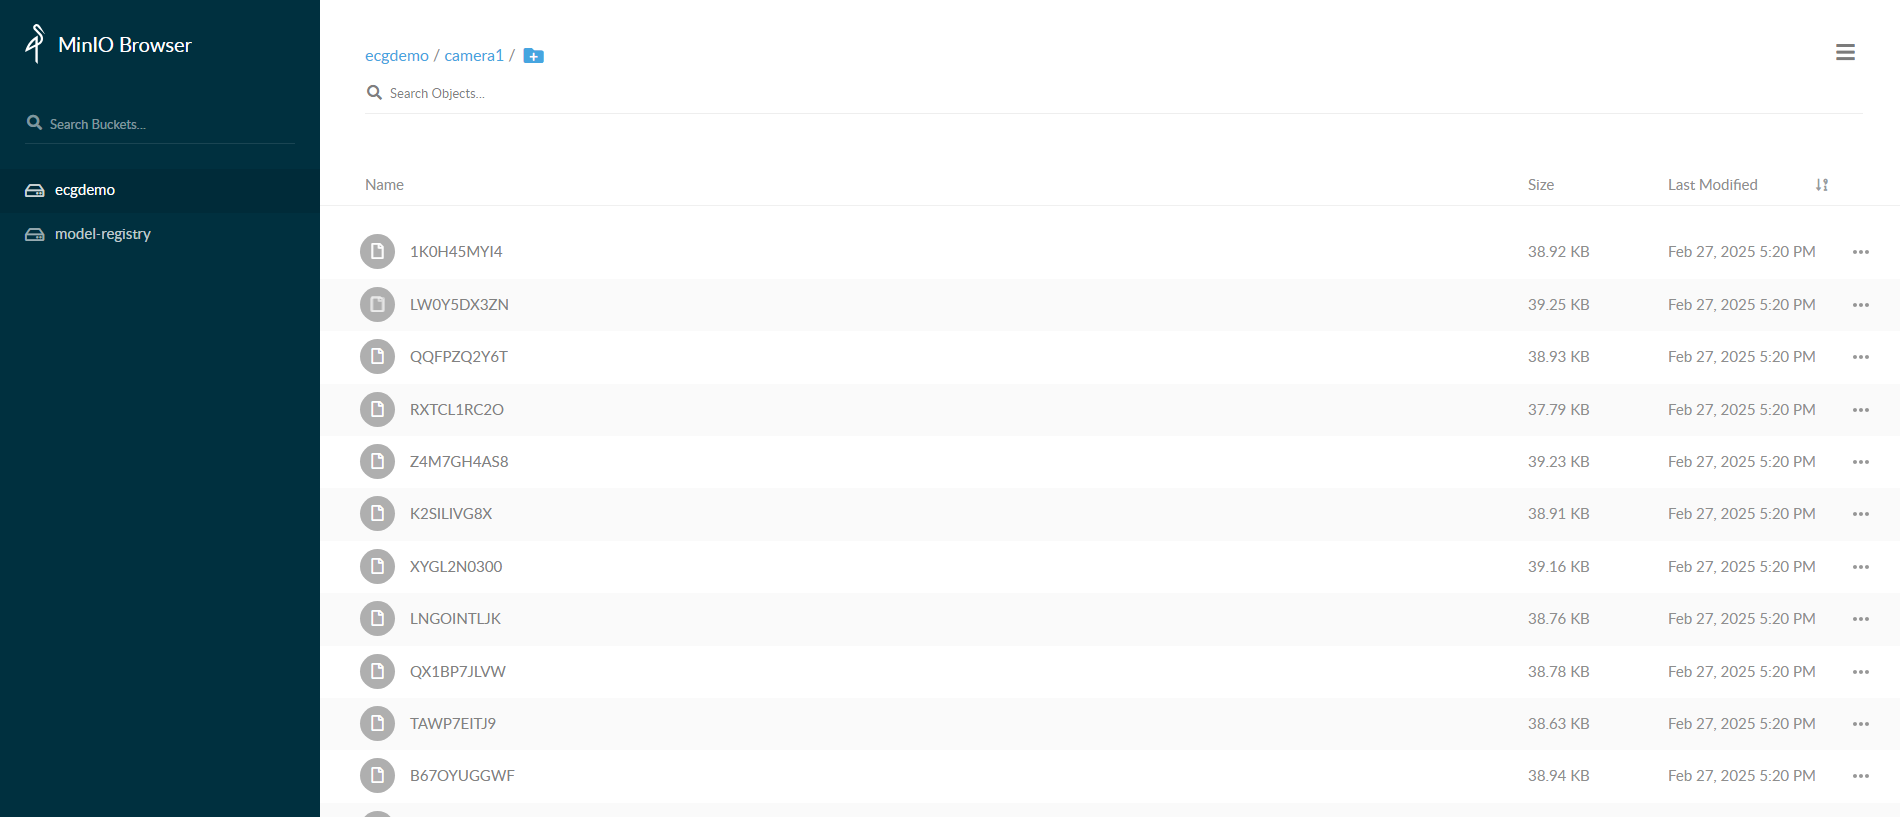
View Open Telemetry Data#
DL Streamer Pipeline Server supports gathering metrics over Open Telemetry. The supported metrics currently are:
cpu_usage_percentage: Tracks CPU usage percentage of DL Streamer Pipeline Server python processmemory_usage_bytes: Tracks memory usage in bytes of DL Streamer Pipeline Server python processfps_per_pipeline: Tracks FPS for each active pipeline instance in DL Streamer Pipeline ServerOpen
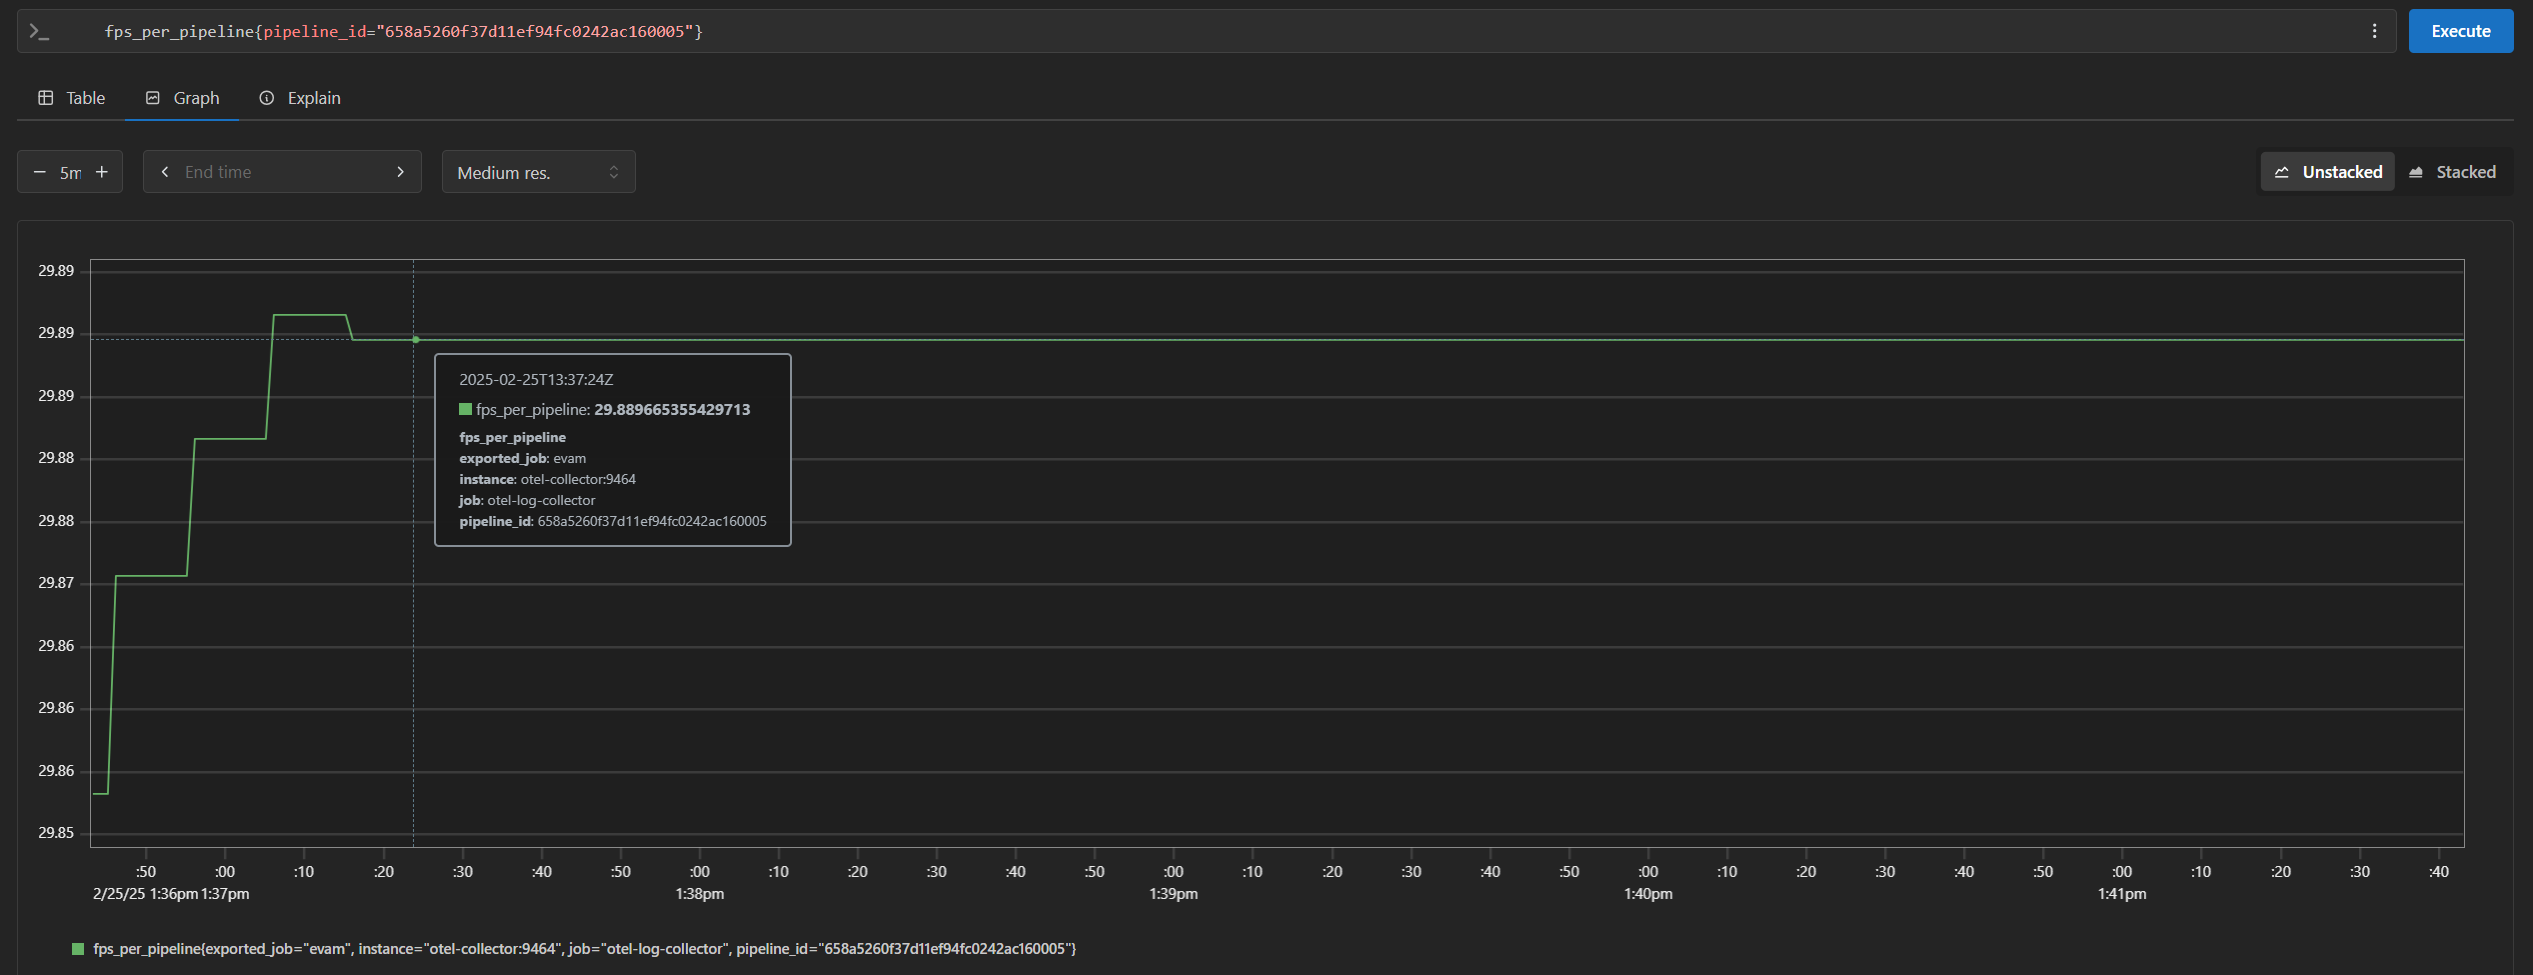
http://<HOST_IP>:<PROMETHEUS_PORT>in your browser to view the prometheus console and try out the below queries (PROMETHEUS_PORTis by default configured as 9999 in.envfile):cpu_usage_percentagememory_usage_bytesfps_per_pipeline{}If you are starting multiple pipelines, then it can also be queried per pipeline ID. Example:
fps_per_pipeline{pipeline_id="658a5260f37d11ef94fc0242ac160005"}
End the demonstration#
Follow this procedure to stop the sample application and end this demonstration.
Stop the sample application with the following command. docker compose down -v
Confirm the containers are no longer running. docker ps
Summary#
In this guide, you installed and validated Weld Porosity Detection. You also completed a demonstration where multiple pipelines run on a single system with near real-time defect classification, saw the MLOps flow and S3 frame storage as well. You also saw the Open Telemetry data over a web dashboard.
Advanced Setup Options#
For alternative ways to set up the microservice, see:
Troubleshooting#
The following are options to help you resolve issues with the sample application.
WebRTC Stream on web browser#
The firewall may prevent you from viewing the video stream on web browser. Please disable the firewall using this command. sudo ufw disable
Error Logs#
View the container logs using this command. docker logs -f <CONTAINER_NAME>
Resolving Time Sync Issues in Prometheus#
If you see the following warning in Prometheus, it indicates a time sync issue.
Warning: Error fetching server time: Detected xxx.xxx seconds time difference between your browser and the server.
You can following the below steps to synchronize system time using NTP.
Install systemd-timesyncd if not already installed:
sudo apt install systemd-timesyncd
Check service status:
systemctl status systemd-timesyncd
Configure an NTP server (if behind a corporate proxy):
sudo nano /etc/systemd/timesyncd.conf
Add:
[Time]
NTP=corp.intel.com
Replace
corp.intel.comwith a different ntp server that is supported on your network.Restart the service:
sudo systemctl restart systemd-timesyncd
Verify the status:
systemctl status systemd-timesyncd
This should resolve the time discrepancy in Prometheus.