How to Deploy with Helm#
Time to Complete: 30 minutes
Programming Language: Python*
Get Started#
Complete this guide to confirm that your setup is working correctly and try out workflows in the sample application.
Prerequisites#
K8s installation on single or multi node must be done as pre-requisite to continue the following deployment. Note: The kubernetes cluster is set up with
kubeadm,kubectlandkubeletpackages on single and multi nodes withv1.30.2. Refer to tutorials such as https://adamtheautomator.com/installing-kubernetes-on-ubuntu and many other online tutorials to setup kubernetes cluster on the web with host OS as ubuntu 22.04.For helm installation, refer to helm website
Note If Ubuntu Desktop is not installed on the target system, follow the instructions from Ubuntu to install Ubuntu desktop.
Download the helm chart#
Follow this procedure on the target system to install the package.
Download helm chart with the following command
helm pull oci://registry-1.docker.io/intel/weld-porosity-sample-application --version 1.1.0unzip the package using the following command
tar xvf weld-porosity-sample-application-1.1.0.tgz
Get into the helm directory
cd weld-porosity-sample-application
Configure and update the environment variables#
Update the below fields in
values.yamlfile in the helm chartHOST_IP: # replace localhost with system IP example: HOST_IP: 10.100.100.100 POSTGRES_PASSWORD: # example: POSTGRES_PASSWORD: intel1234 MINIO_ACCESS_KEY: # example: MINIO_ACCESS_KEY: intel1234 MINIO_SECRET_KEY: # example: MINIO_SECRET_KEY: intel1234 http_proxy: # example: http_proxy: http://proxy.example.com:891 https_proxy: # example: http_proxy: http://proxy.example.com:891 webrtcturnserver: username: # example: username: myuser password: # example: password: mypassword
Copy the welding model and video for helm deployment to DL Streamer Pipeline Server#
You need to copy your own or existing model into DL Streamer Pipeline Server inorder to run this sample application in kubernates enviornment:
The weld porosity classification model is placed as below in the repository under
models. You can also find the input video file source for inference undervideos.
resources/
models/
weld_porosity/
weld_porosity_classification/
deployment/
Classification/
model/
model.bin
model.xml
videos/
welding.avi
Note You can organize the directory structure for models for different use cases.
Copy your new AI model (weld porosity classification model used here as an example) and video file to
dlstreamer-pipeline-serverpod.POD_NAME=$(kubectl get pods -n apps -o jsonpath='{.items[*].metadata.name}' | tr ' ' '\n' | grep deployment-dlstreamer-pipeline-server | head -n 1) kubectl cp <repo_workdir>/resources/videos/welding.avi $POD_NAME:/home/pipeline-server/resources/videos/ -c dlstreamer-pipeline-server -n apps kubectl cp <repo_workdir>/resources/models/weld_porosity/ $POD_NAME:/home/pipeline-server/resources/models/ -c dlstreamer-pipeline-server -n appsNote You need to run the above commands only after performing the Helm install, and before executing any pipeline. Make sure to replace the ‘apps’ namespace in the above command with the namespace you are using.
Since this is a classification model, ensure to use gvaclassify in the pipeline. For example: See the
weld_porosity_classificationpipeline inconfig.json(present in the repository) where gvaclassify is used.The
config.jsonis volume mounted into DL Streamer Pipeline Server inprovision-configmap.yamlas follows:apiVersion: v1 kind: ConfigMap metadata: namespace: {{ .Values.namespace }} name: dlstreamer-pipeline-server-config-input data: config.json: |- {{ .Files.Get "config.json" | indent 4 }}
Provide the model path and video file path in the REST/curl command for starting an inferencing workload. Example:
curl http://<HOST_IP>:31107/pipelines/user_defined_pipelines/weld_porosity_classification -X POST -H 'Content-Type: application/json' -d '{
    "source": {
        "uri": "file:///home/pipeline-server/resources/videos/welding.avi",
        "type": "uri"
    },
    "destination": {
        "frame": {
            "type": "webrtc",
            "peer-id": "samplestream"
        }
    },
    "parameters": {
        "classification-properties": {
                "model": "/home/pipeline-server/resources/models/weld_porosity/weld_porosity_classification/deployment/Classification/model/model.xml",
                "device": "CPU"
        }
    }
}'
Run multiple AI pipelines#
Follow this procedure to run the sample application. In a typical deployment, multiple cameras deliver video streams that are connected to AI pipelines to improve the classification and recognition accuracy. The following demonstrates running two AI pipelines and observing telemetry data from Prometheus* UI.
Deploy helm chart
helm install weld-deploy . -n apps --create-namespace
Verify all the pods and services are running:
kubectl get pods -n apps
kubectl get svc -n apps
Start the weld porosity classification pipeline with the following Client URL (cURL) command by replacing the
<peer-str-id>with a string id eg:weld. This pipeline is configured to run in a loop forever. This REST/cURL request will return a pipeline instance ID, which can be used as an identifier to query later the pipeline status or stop the pipeline instance. For example, a6d67224eacc11ec9f360242c0a86003.curl http://<HOST_IP>:31107/pipelines/user_defined_pipelines/weld_porosity_classification_mlops -X POST -H 'Content-Type: application/json' -d '{ "destination": { "frame": { "type": "webrtc", "peer-id": "<peer-str-id>" } }, "parameters": { "classification-properties": { "model": "/home/pipeline-server/resources/models/weld_porosity/weld_porosity_classification/deployment/Classification/model/model.xml", "device": "CPU" } } }'
Start another weld porosity classification pipeline with the following Client URL (cURL) command by replacing the
<different-peer-str-id>with a different string id than the one in above step. eg:weldstream. This pipeline is not configured to run in a loop forever. This REST/cURL request will return a pipeline instance ID, which can be used as an identifier to query later the pipeline status or stop the pipeline instance. For example, a6d67224eacc11ec9f360242c0a86003.curl http://<HOST_IP>:31107/pipelines/user_defined_pipelines/weld_porosity_classification -X POST -H 'Content-Type: application/json' -d '{ "source": { "uri": "file:///home/pipeline-server/resources/videos/welding.avi", "type": "uri" }, "destination": { "frame": { "type": "webrtc", "peer-id": "<different-peer-str-id>" } }, "parameters": { "classification-properties": { "model": "/home/pipeline-server/resources/models/weld_porosity/weld_porosity_classification/deployment/Classification/model/model.xml", "device": "CPU" } } }'
Note: Note the instance ID of this pipeline
View the WebRTC streaming on
http://<HOST_IP>:<mediamtx-port>/<peer-str-id>andhttp://<HOST_IP>:<mediamtx-port>/<different-peer-str-id>.mediamtx-portin this case would be 32111 as configured in .env file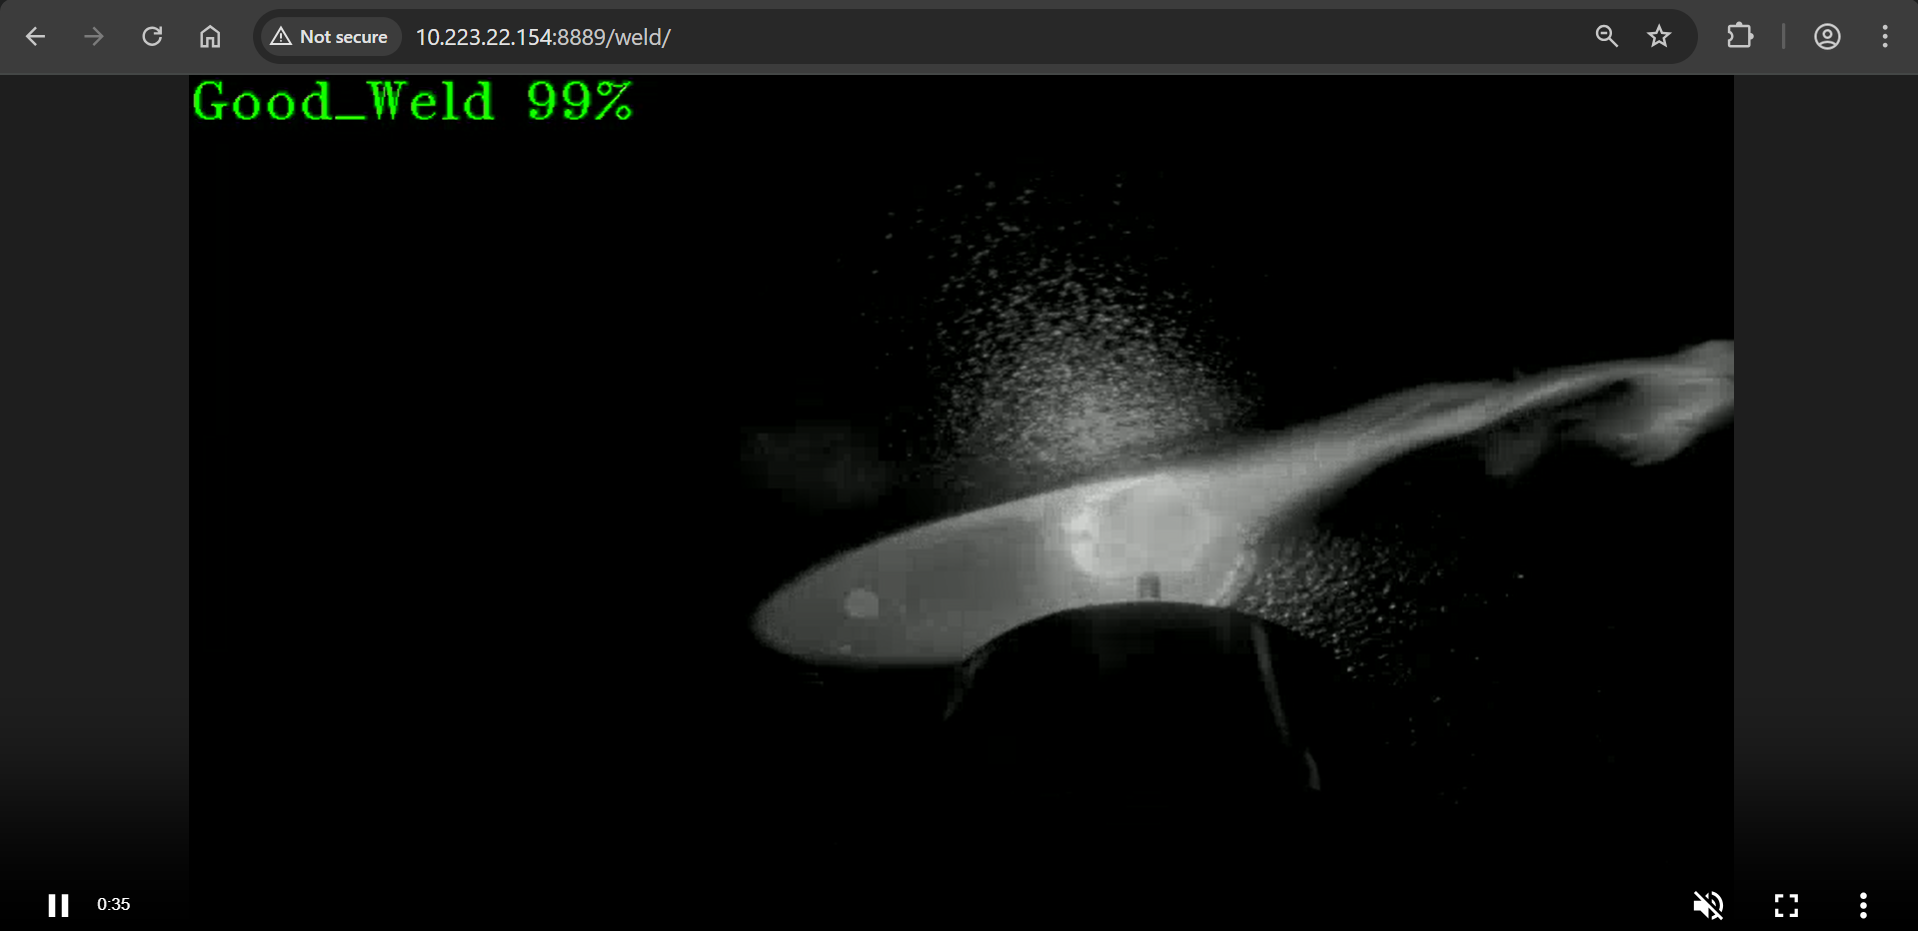
Figure 1: WebRTC streaming
You can view the welding video, where each frame is categorized by the percentage of Good_Weld, Porosity, and No_Weld.
Stop the 2nd pipeline using the instance ID noted in point #4 above, before proceeding with this documentation.
curl --location -X DELETE http://<HOST_IP>:31107/pipelines/{instance_id}
MLOps Flow: At runtime, download a new model from model registry and restart the pipeline with the new model.#
Note: We have removed "model-instance-id=inst0" from the weld_porosity_classification_mlops pipeline in config.json to ensure the proper loading of the new AI model in the MLOps flow. However, as a general rule, keeping "model-instance-id=inst0" in a pipeline is recommended for better performance if you are running multiple instances of the same pipeline.
Get all the registered models in the model registry
curl -X GET 'http://<HOST_IP>:32102/models'
The following step demonstrates how to create a sample model file from an existing model folder for uploading to the Model Registry. If you already have a model zip file, you can skip this step.
 cd <weld_porosity_sample_application_repo_workdir>/resources/models/weld_porosity/weld_porosity_classification
 zip -r ../weld_porosity_classification.zip .
You can utilize the generated
<path>/weld_porosity_classification.zipas<model_file_path.zip>in the next stepUpload a model file to Model Registry
curl -L -X POST "http://<HOST_IP>:32102/models" \
-H 'Content-Type: multipart/form-data' \
-F 'name="YOLO_Test_Model"' \
-F 'precision="fp32"' \
-F 'version="v1"' \
-F 'origin="Geti"' \
-F 'file=@<model_file_path.zip>;type=application/zip' \
-F 'project_name="weld-porosity-classification"' \
-F 'architecture="YOLO"' \
-F 'category="Classification"'
Check instance ID of currently running pipeline and use it in the next command
curl --location -X GET http://<HOST_IP>:31107/pipelines/status
Download the files for a specific model from the model registry microservice and restart the running pipeline with the new model. Essentially, the running instance gets aborted and a new instance gets started.
curl 'http://<HOST_IP>:31107/pipelines/user_defined_pipelines/weld_porosity_classification_mlops/<instance_id_of_currently_running_pipeline>/models' \
--header 'Content-Type: application/json' \
--data '{
     "project_name": "weld-porosity-classification",
     "version": "v1",
     "category": "Classification",
     "architecture": "YOLO",
     "precision": "fp32",
     "deploy": true,
     "pipeline_element_name": "classification",
     "origin": "Geti",
     "name": "YOLO_Test_Model"
}'
Note: The data above assumes there is a model in the registry that contains these properties. Note: The pipeline name that follows user_defined_pipelines, will affect the
deploymentfolder name.View the WebRTC streaming on
http://<HOST_IP>:<mediamtx-port>/<peer-str-id>by replacing<peer-str-id>with the value used in the cURL command to start the pipeline.Figure 2: WebRTC streaming
You can also stop any running pipeline by using the pipeline instance “id”
curl --location -X DELETE http://<HOST_IP>:31107/pipelines/{instance_id}
DL Streamer Pipeline Server S3 frame storage#
Follow this procedure to test the DL Streamer Pipeline Server S3 storage using the helm.
Install the pip package boto3 once if not installed with the following command
pip3 install boto3==1.36.17
Create a S3 bucket using the following script.
import boto3
url = "http://<HOST_IP>:31800"
user = "<value of MINIO_ACCESS_KEY used in .env>"
password = "<value of MINIO_SECRET_KEY used in .env>"
bucket_name = "ecgdemo"

client= boto3.client(
            "s3",
            endpoint_url=url,
            aws_access_key_id=user,
            aws_secret_access_key=password
)
client.create_bucket(Bucket=bucket_name)
buckets = client.list_buckets()
print("Buckets:", [b["Name"] for b in buckets.get("Buckets", [])])
Start the pipeline with the following cURL command. Ensure to give the correct path to the model as seen below. This example starts an AI pipeline.
 curl http://<HOST_IP>:31107/pipelines/user_defined_pipelines/weld_porosity_classification_s3write -X POST -H 'Content-Type: application/json' -d '{
     "source": {
         "uri": "file:///home/pipeline-server/resources/videos/welding.avi",
         "type": "uri"
     },
     "destination": {
         "frame": {
             "type": "webrtc",
             "peer-id": "welds3"
         }
     },
     "parameters": {
         "classification-properties": {
             "model": "/home/pipeline-server/resources/models/weld_porosity/weld_porosity_classification/deployment/Classification/model/model.xml",
             "device": "CPU"
         }
     }
 }'
Go to MinIO console on
http://<HOST_IP>:31800/and login withMINIO_ACCESS_KEYandMINIO_SECRET_KEYprovided invalues.ymlfile. After logging into console, you can go toecgdemobucket and check the frames stored.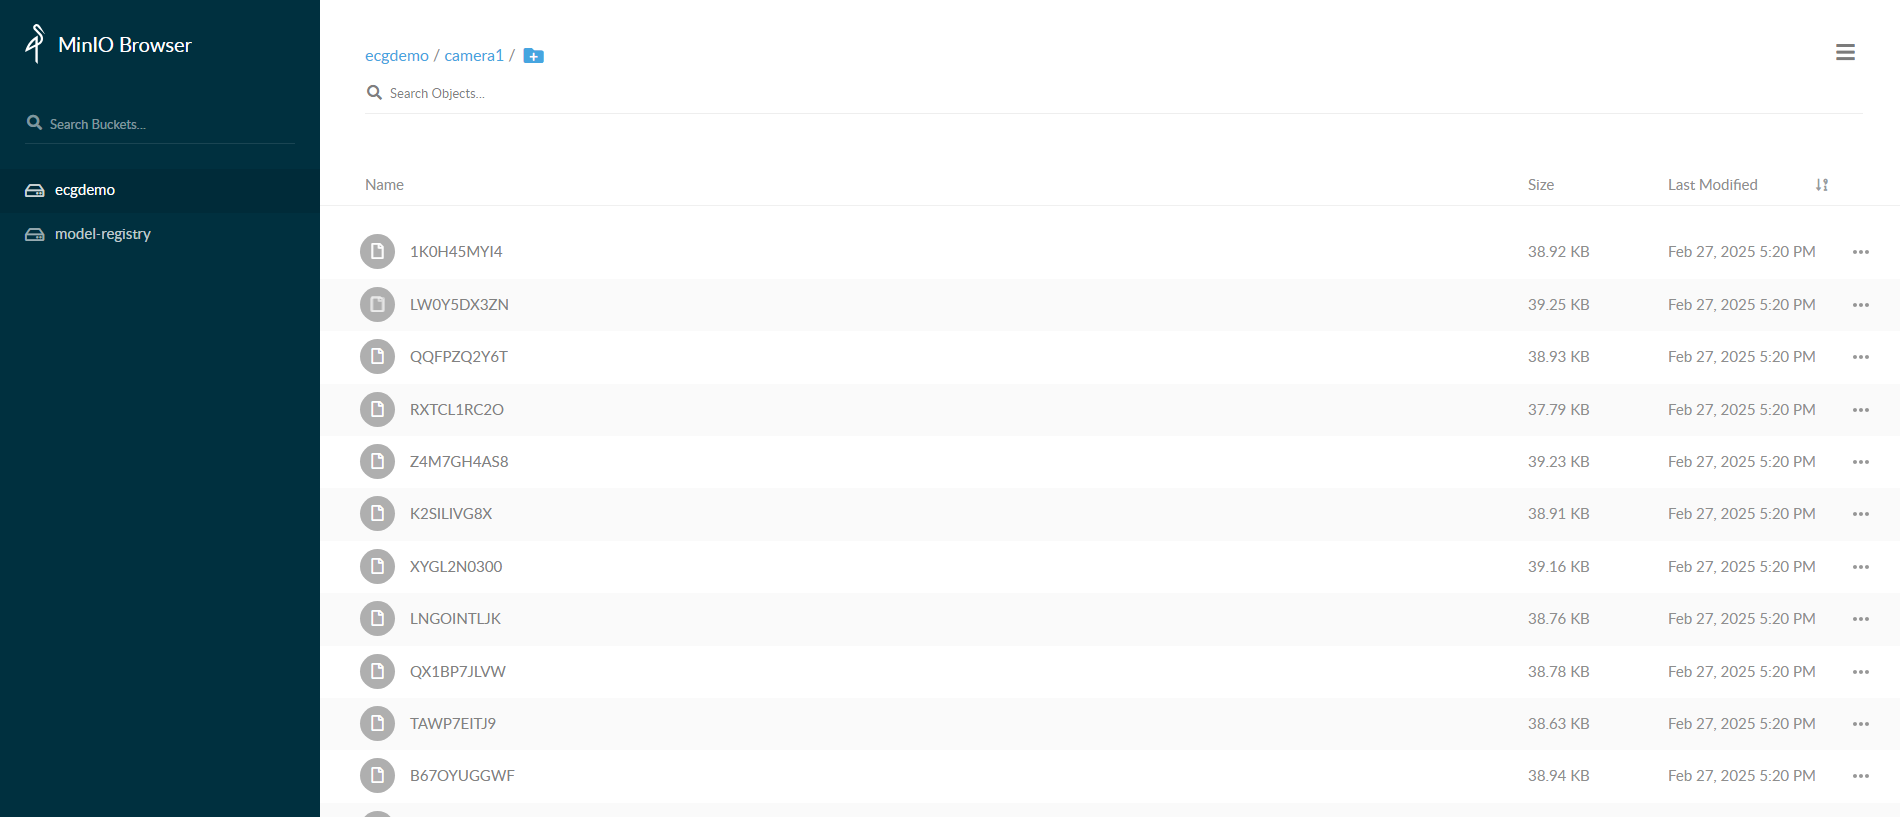
View Open Telemetry Data#
DL Streamer Pipeline Server supports gathering metrics over Open Telemetry. The supported metrics currently are:
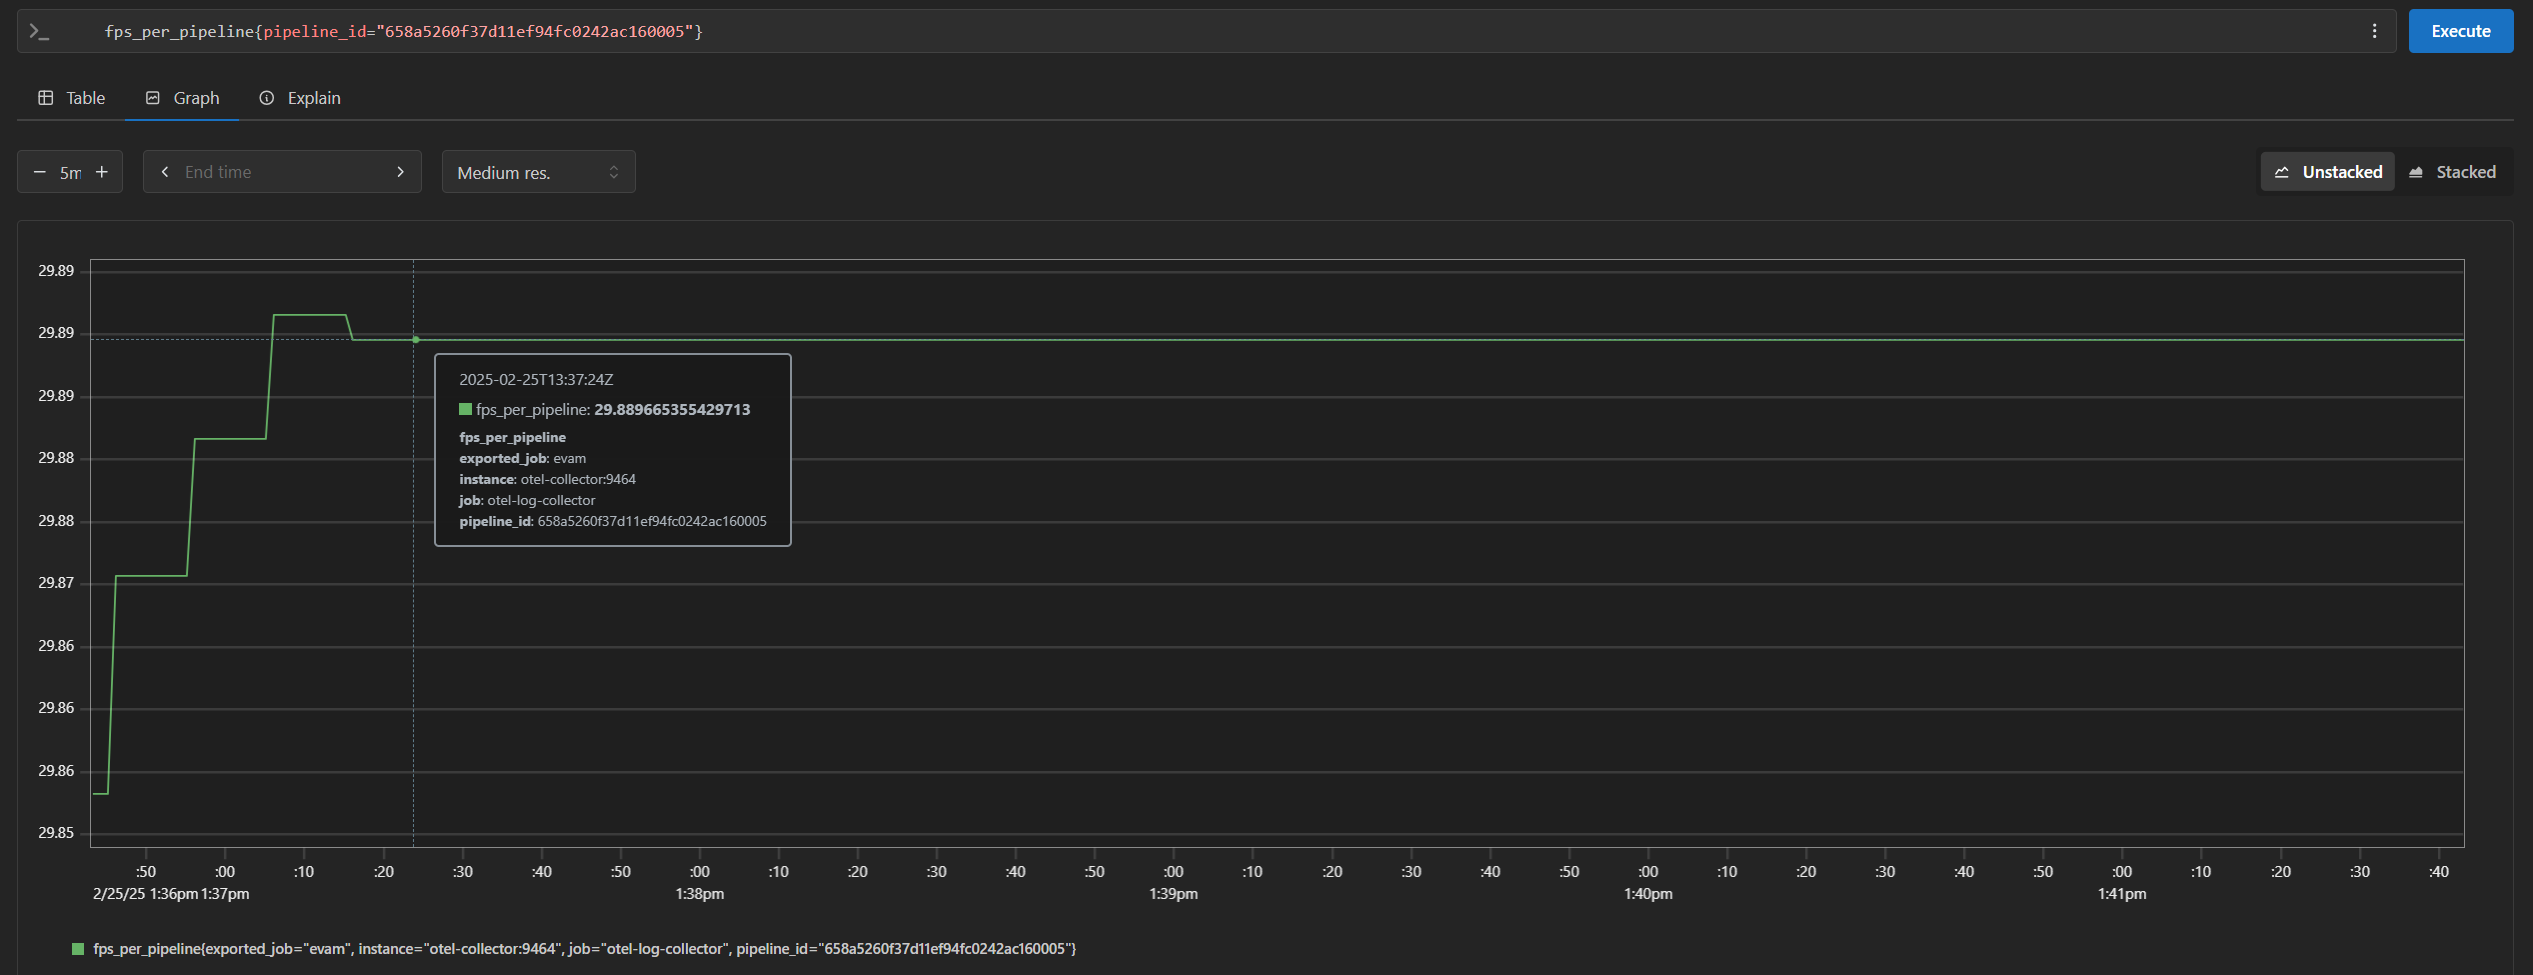
cpu_usage_percentage: Tracks CPU usage percentage of DL Streamer Pipeline Server python processmemory_usage_bytes: Tracks memory usage in bytes of DL Streamer Pipeline Server python processfps_per_pipeline: Tracks FPS for each active pipeline instance in DL Streamer Pipeline ServerOpen
http://<HOST_IP>:31909in your browser to view the prometheus console and try out the below queries:cpu_usage_percentagememory_usage_bytesfps_per_pipeline{}If you are starting multiple pipelines, then it can also be queried per pipeline ID. Example:
fps_per_pipeline{pipeline_id="658a5260f37d11ef94fc0242ac160005"}
End the demonstration#
Follow this procedure to stop the sample application and end this demonstration.
Stop the sample application with the following command that uninstalls the release weld-deploy.
helm uninstall weld-deploy -n apps
Confirm the pods are no longer running.
kubectl get pods -n apps
Summary#
In this guide, you installed and validated Weld Porosity Detection. You also completed a demonstration where multiple pipelines run on a single system with near real-time classification.
Troubleshooting#
The following are options to help you resolve issues with the sample application.
Deploying with Intel GPU K8S Extension on ITEP#
If you’re deploying a GPU based pipeline (example: with VA-API elements like vapostproc, vah264dec etc., and/or with device=GPU in gvadetect in config.json) with Intel GPU k8s Extension on ITEP, ensure to set the below details in the file helm/values.yaml appropriately in order to utilize the underlying GPU.
gpu:
  enabled: true
  type: "gpu.intel.com/i915"
  count: 1
Deploying without Intel GPU K8S Extension#
If you’re deploying a GPU based pipeline (example: with VA-API elements like vapostproc, vah264dec etc., and/or with device=GPU in gvadetect in config.json) without Intel GPU k8s Extension, ensure to set the below details in the file helm/values.yaml appropriately in order to utilize the underlying GPU.
privileged_access_required: true
Error Logs#
View the container logs using this command.
kubectl logs -f <pod_name> -n apps
Resolving Time Sync Issues in Prometheus#
If you see the following warning in Prometheus, it indicates a time sync issue.
Warning: Error fetching server time: Detected xxx.xxx seconds time difference between your browser and the server.
You can following the below steps to synchronize system time using NTP.
Install systemd-timesyncd if not already installed:
sudo apt install systemd-timesyncd
Check service status:
systemctl status systemd-timesyncd
Configure an NTP server (if behind a corporate proxy):
sudo nano /etc/systemd/timesyncd.conf
Add:
[Time]
NTP=corp.intel.com
Replace
corp.intel.comwith a different ntp server that is supported on your network.Restart the service:
sudo systemctl restart systemd-timesyncd
Verify the status:
systemctl status systemd-timesyncd
This should resolve the time discrepancy in Prometheus.